Exam 19: Factor Markets and the Distribution of Income
Exam 1: First Principles233 Questions
Exam 2: Economic Models: Trade-Offs and Trade 25382 Questions
Exam 3: Supply and Demand290 Questions
Exam 4: Consumer and Producer Surplus224 Questions
Exam 5: Price Controls and Quotas: Meddling With Markets227 Questions
Exam 6: Elasticity300 Questions
Exam 7: Taxes298 Questions
Exam 8: International Trade272 Questions
Exam 9: Decision Making by Individuals Firms201 Questions
Exam 10: The Rational Consumer372 Questions
Exam 11: Behind the Supply Curve: Inputs and Costs362 Questions
Exam 12: Perfect Competition and the Supply Curve355 Questions
Exam 13: Monopoly350 Questions
Exam 14: Oligopoly294 Questions
Exam 15: Monopolistic Competition and Product Differentiation262 Questions
Exam 16: Externalities199 Questions
Exam 17: Public Goods Common Resources224 Questions
Exam 18: The Economics of the Welfare140 Questions
Exam 19: Factor Markets and the Distribution of Income369 Questions
Exam 20: Uncertainty, Risk, and Private Information202 Questions
Select questions type
Use the following to answer questions: 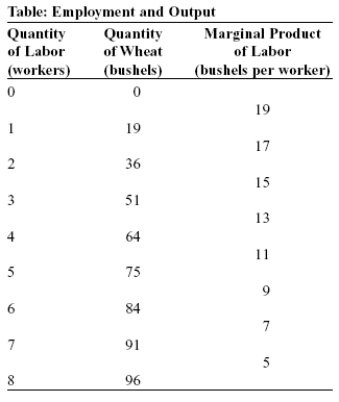 -(Table: Employment and Output) In the table Employment and Output, if the price of a bushel of wheat is $10 and the price of labor (wage) is $120, then the profit-maximizing quantity of labor is:
(Multiple Choice)
4.9/5  (34)
(34)
If the age at which a person can receive Social Security benefits increases from 67 to 70, the supply of labor will increase.
(True/False)
4.9/5 (36)
If leisure is a normal good for Randy, then both the substitution effect and the income effect of a decrease in the wage rate will cause Randy to work fewer hours.
(True/False)
5.0/5 (48)
Since the Great Recession, which began in 2008, the U.S. labor supply curve has shifted to the left because many workers were disillusioned by bad job prospects and left the labor force.
(True/False)
4.9/5 (45)
The equilibrium value of the marginal product of a factor is the additional value produced by the last unit of that factor employed in the factor market as a whole.
(True/False)
4.8/5 (35)
Use the following to answer questions:
Figure: Davina's Labor Supply Choice 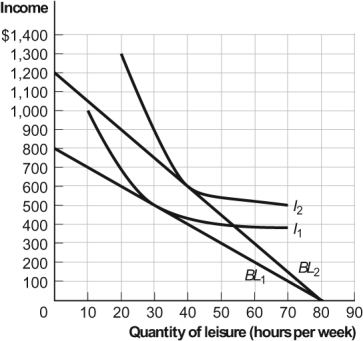 -(Figure: Davina's Labor Supply Choice) The figure Davina's Labor Supply Choice shows Davina's time allocation budget line when her hourly wage is $10 or $15 and she has 80 hours to allocate between labor and leisure; it also shows two of her indifference curves for income and leisure. When Davina earns $15 per hour, she works _____ hours and enjoys _____ hours of leisure.
(Multiple Choice)
4.8/5 (33)
Suppose a firm sells a good for a perfectly competitive price of $5. The equilibrium wage rate is $10. The first worker it hires produces five units. Two workers produce a total of nine units. Given this information, the firm will:
(Multiple Choice)
4.9/5 (37)
Regardless of gender and ethnicity, more education is associated with higher median earnings.
(True/False)
4.7/5 (31)
Use the following to answer questions: 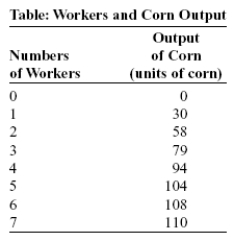 -(Table: Workers and Corn Output) Look at the table Workers and Corn Output. Laura is a price-taking farmer who produces corn. Assume the wage rate for workers is $250 and the price per bushel of corn is $20. Laura should hire _____ workers to maximize profits.
(Multiple Choice)
4.8/5 (37)
If an individual labor supply curve is negatively sloped, the substitution effect dominates the income effect.
(True/False)
4.8/5 (32)
Over the past 30 years the premium for workers with advanced degrees has decreased.
(True/False)
4.9/5 (36)
Workers with more human capital usually generate a higher value of the marginal product.
(True/False)
4.8/5 (30)
The equilibrium value of the marginal product of a factor is the additional value produced by the _____ unit of that factor employed in the factor market as a whole.
(Multiple Choice)
4.8/5 (39)
In the U.S. labor market, White men have the highest median earnings.
(True/False)
4.9/5 (45)
Use the following to answer questions: 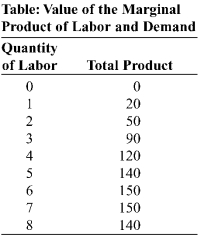 -(Table: Value of the Marginal Product of Labor and Demand) In the figure Value of the Marginal Product of Labor and Demand, the total product of labor is shown for the hourly production of power cords. Assume that the market for power cords is perfectly competitive. If the price of a power cord is $2 and the market wage rate is $60 per hour, the profit-maximizing quantity of labor is _____ workers.
(Multiple Choice)
4.8/5 (41)
Use the following to answer questions:
Figure: Rita's Time Allocation Budget Line 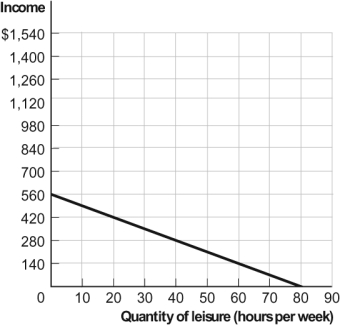 -(Figure: Rita's Time Allocation Budget Line) Look at the figure Rita's Time Allocation Budget Line. It is based on 80 hours available for labor and leisure. Her hourly wage is:
(Multiple Choice)
4.8/5 (48)
Filters
- Essay(0)
- Multiple Choice(0)
- Short Answer(0)
- True False(0)
- Matching(0)