Exam 19: Factor Markets and the Distribution of Income
Exam 1: First Principles233 Questions
Exam 2: Economic Models: Trade-Offs and Trade 25382 Questions
Exam 3: Supply and Demand290 Questions
Exam 4: Consumer and Producer Surplus224 Questions
Exam 5: Price Controls and Quotas: Meddling With Markets227 Questions
Exam 6: Elasticity300 Questions
Exam 7: Taxes298 Questions
Exam 8: International Trade272 Questions
Exam 9: Decision Making by Individuals Firms201 Questions
Exam 10: The Rational Consumer372 Questions
Exam 11: Behind the Supply Curve: Inputs and Costs362 Questions
Exam 12: Perfect Competition and the Supply Curve355 Questions
Exam 13: Monopoly350 Questions
Exam 14: Oligopoly294 Questions
Exam 15: Monopolistic Competition and Product Differentiation262 Questions
Exam 16: Externalities199 Questions
Exam 17: Public Goods Common Resources224 Questions
Exam 18: The Economics of the Welfare140 Questions
Exam 19: Factor Markets and the Distribution of Income369 Questions
Exam 20: Uncertainty, Risk, and Private Information202 Questions
Select questions type
When interferences in the labor market raise the wage above the equilibrium level, employers may discriminate because there are more job applicants than jobs.
(True/False)
4.8/5  (33)
(33)
Median earning in the U.S. labor market is highest for White men, followed by African Americans, followed by women regardless of ethnicity, and then Hispanics.
(True/False)
4.9/5 (45)
Use the following to answer questions: 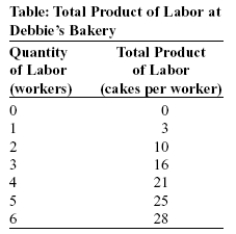 -(Table: Total Product of Labor at Debbie's Bakery) Look at the table Total Product of Labor at Debbie's Bakery. Debbie can sell cakes at $10 each. If Debbie must pay each worker $40 per day, how many workers will she hire to maximize profit?
(Multiple Choice)
4.8/5 (34)
A nurse willing to work the midnight to 8 A.M. shift may make more than one who works 8 A.M. to 4 P.M. because of:
(Multiple Choice)
4.8/5 (37)
If John's wage increases from $10 to $12 per hour, his opportunity cost of leisure has decreased or increased, depending on what he does with an hour of leisure.
(True/False)
4.9/5 (37)
If the hourly wage increases from $8 to $10 an hour and in response Jim increases the number of hours that he works from 44 to 46, the income effect is dominant.
(True/False)
5.0/5 (38)
In 2012, the median earnings of union members were actually lower than the wages of workers not represented by unions.
(True/False)
4.7/5 (33)
Use the following to answer questions:
Figure: The Value of the Marginal Product Curve 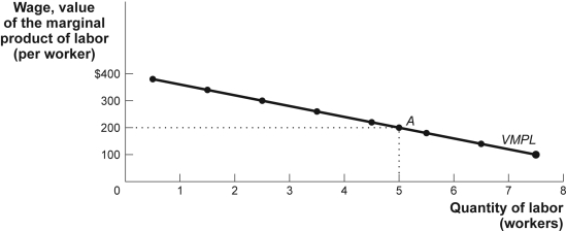 -(Figure: The Value of the Marginal Product Curve) In the figure The Value of the Marginal Product Curve, if the market wage rate increases:
(Multiple Choice)
4.8/5 (38)
Use the following to answer questions:
Scenario: The Decision to Hire Labor
Assume that both the product market and the labor market are perfectly competitive. The price of this firm's product is $5. The firm's total product with respect to labor is given in the table that follows. 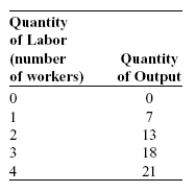 -(Scenario: The Decision to Hire Labor) Look at the scenario The Decision to Hire Labor. What is the value of the marginal product of the third worker to this firm?
(Multiple Choice)
4.9/5 (33)
For the Tampa Bay Rays baseball team, the value of the marginal product curve is the team's labor _____ curve. This means the marginal product curve has a _____ slope.
(Multiple Choice)
4.9/5 (37)
Wage differences between men and women and among various ethnic groups are proof that the marginal productivity theory of income distribution is invalid.
(True/False)
4.8/5 (29)
Suppose Mike wants to pay efficiency wages to help in the construction of his beach home. If the prevailing wage rate for electricians is $22 per hour in his area, he will probably pay:
(Multiple Choice)
4.9/5 (38)
Use the following to answer questions:
Scenario: The Decision to Hire Labor
Assume that both the product market and the labor market are perfectly competitive. The price of this firm's product is $5. The firm's total product with respect to labor is given in the table that follows.
-(Scenario: The Decision to Hire Labor) Look at the scenario The Decision to Hire Labor. This firm experiences diminishing marginal product after it hires the _____ worker.
(Multiple Choice)
4.9/5 (37)
Use the following to answer questions:
Figure: Equilibrium in the Labor Market 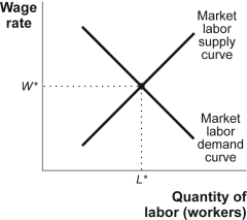 -(Figure: Equilibrium in the Labor Market) In the figure Equilibrium in the Labor Market, a decrease in population that decreases the number of workers, when everything else stays the same, will lead to a(n) _____ in the equilibrium quantity of labor and a(n) _____ in the equilibrium price of labor.
(Multiple Choice)
4.8/5 (35)
An input differs from a factor of production in that the former gets used up in production, while the latter is an enduring source of income for its owner.
(True/False)
4.8/5 (39)
Use the following to answer questions:
Figure: Income and Leisure Opportunities 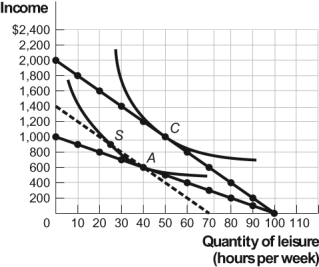 -(Figure: Income and Leisure Opportunities) The figure Income and Leisure Opportunities refers to Keisha when she has 100 hours per week for working or leisure. There are two time allocation lines, one for a $10 hourly wage rate and one for a $20 hourly wage rate. Keisha's optimal choice is point A when the wage is $10, and her optimal choice is point C when the wage is $20. As the amount she earns increases from $10 per hour to $20 per hour, Keisha will work _____ hours because of the income effect.
(Multiple Choice)
4.9/5 (45)
Although improved technology can either increase or decrease the demand for a factor of production, the usual effect of technological progress is to reduce demand for labor, holding everything else constant.
(True/False)
4.8/5 (41)
In the markets for goods and services, households demand goods and services and firms supply goods and services.
(True/False)
4.8/5 (43)
The category compensation of employees doesn't capture the full income of labor because:
(Multiple Choice)
4.8/5 (35)
A wage _____ raises the quantity of labor supplied through the _____ effect.
(Multiple Choice)
4.9/5 (36)
Filters
- Essay(0)
- Multiple Choice(0)
- Short Answer(0)
- True False(0)
- Matching(0)