Exam 11: Behind the Supply Curve: Inputs and Costs
Exam 1: First Principles233 Questions
Exam 2: Economic Models: Trade-Offs and Trade 25382 Questions
Exam 3: Supply and Demand290 Questions
Exam 4: Consumer and Producer Surplus224 Questions
Exam 5: Price Controls and Quotas: Meddling With Markets227 Questions
Exam 6: Elasticity300 Questions
Exam 7: Taxes298 Questions
Exam 8: International Trade272 Questions
Exam 9: Decision Making by Individuals Firms201 Questions
Exam 10: The Rational Consumer372 Questions
Exam 11: Behind the Supply Curve: Inputs and Costs362 Questions
Exam 12: Perfect Competition and the Supply Curve355 Questions
Exam 13: Monopoly350 Questions
Exam 14: Oligopoly294 Questions
Exam 15: Monopolistic Competition and Product Differentiation262 Questions
Exam 16: Externalities199 Questions
Exam 17: Public Goods Common Resources224 Questions
Exam 18: The Economics of the Welfare140 Questions
Exam 19: Factor Markets and the Distribution of Income369 Questions
Exam 20: Uncertainty, Risk, and Private Information202 Questions
Select questions type
Use the following to answer questions:
Figure: Short-Run Costs 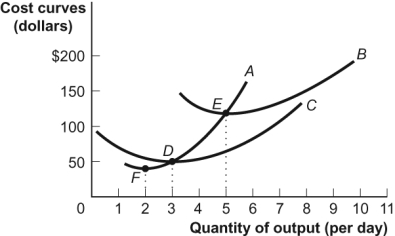 -(Figure: Short-Run Costs) Look at the figure Short-Run Costs. B is the _____ cost curve.
(Multiple Choice)
4.7/5  (29)
(29)
The slope of the total product curve is equal to the average product of labor.
(True/False)
4.8/5 (38)
If marginal cost is greater than average total cost, then average total cost is:
(Multiple Choice)
4.8/5 (30)
If a firm has to increase output suddenly to meet an increase in demand, its average total cost will increase in the short run until it has time to add physical capital.
(True/False)
4.9/5 (38)
Use the following to answer questions:
Figure: The Total Product 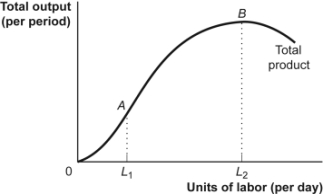 -(Figure: The Total Product) Look at the figure The Total Product. After hiring L2 labor and producing at point B on the total product curve, hiring more labor beyond L2 would cause the:
(Multiple Choice)
4.9/5 (41)
Use the following to answer questions: 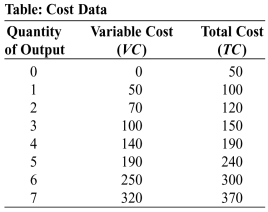 -(Table: Cost Data) Look at the table Cost Data. The average total cost of producing 2 purses is:
(Multiple Choice)
4.8/5 (35)
In the short run, the average total cost curve always lies above the average variable cost curve.
(True/False)
4.8/5 (35)
The curve that illustrates the relationship between output and average total cost when the fixed cost has been chosen to minimize average total cost for each level of output is the _____ curve.
(Multiple Choice)
4.7/5 (40)
It is time to pay the bills. You pay the rent, the basic cable bill, the electricity bill, and your grocery bill. Which of these are good examples of fixed costs and which are variable costs? Explain your reasoning.
(Essay)
4.8/5 (36)
Decreasing and increasing returns to scale account for the shape of the:
(Multiple Choice)
4.9/5 (34)
The _____ curve shows the additional cost of producing each additional unit of output.
(Multiple Choice)
4.9/5 (34)
The long-run average total cost curve shows the relationship between output and the average total cost when variable cost has been chosen to minimize average total cost for each level of output.
(True/False)
4.8/5 (42)
Use the following to answer questions: 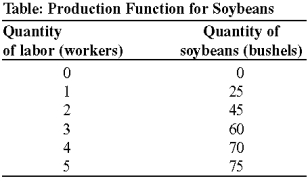 -(Table: Production Function for Soybeans) Look at the table Production Function for Soybeans. Assume that the fixed input, capital, is 10 acres of land and a tractor, which have a combined cost of $150 per day. The cost of labor is $100 per worker per day. The variable cost of producing 45 bushels of soybeans is:
(Multiple Choice)
4.8/5 (32)
Use the following to answer questions:
-(Table: Cost Data) Look at the table Cost Data. The average total cost of producing 4 purses is:
(Multiple Choice)
4.8/5 (39)
In the short run, if marginal cost is higher than average total cost, producing an extra unit of output must raise average total cost.
(True/False)
4.9/5 (34)
Use the following to answer questions:
Figure: Short-Run Costs II 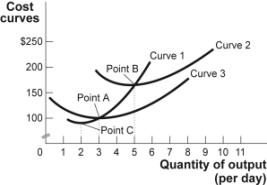 -(Figure: Short-Run Costs II) Look at the figure Short-Run Costs II. Curve 1 crosses the average total cost curve at:
(Multiple Choice)
4.8/5 (39)
The long-run average total cost of producing 100 units of output is $4, while the long-run average cost of producing 110 units of output is $4. These numbers suggest that the firm producing this output has:
(Multiple Choice)
4.8/5 (26)
Filters
- Essay(0)
- Multiple Choice(0)
- Short Answer(0)
- True False(0)
- Matching(0)