Exam 5: Individual and Market Demand
Exam 1: Adventures in Microeconomics20 Questions
Exam 2: Supply and Demand148 Questions
Exam 3: Using Supply and Demand to Analyze Markets146 Questions
Exam 4: Consumer Behavior130 Questions
Exam 5: Individual and Market Demand146 Questions
Exam 6: Producer Behavior142 Questions
Exam 7: Costs179 Questions
Exam 8: Supply in a Competitive Market148 Questions
Exam 9: Market Power and Monopoly162 Questions
Exam 10: Market Power and Pricing Strategies165 Questions
Exam 11: Imperfect Competition172 Questions
Exam 12: Game Theory170 Questions
Exam 13: Factor Markets94 Questions
Exam 14: Investment, Time, and Insurance117 Questions
Exam 15: General Equilibrium97 Questions
Exam 16: Asymmetric Information106 Questions
Exam 17: Externalities and Public Goods114 Questions
Exam 18: Behavioral and Experimental Economics112 Questions
Select questions type
(Figure: Batting Gloves and Baseball Hats I) The income effect of the price increase causes consumption of baseball hats to: 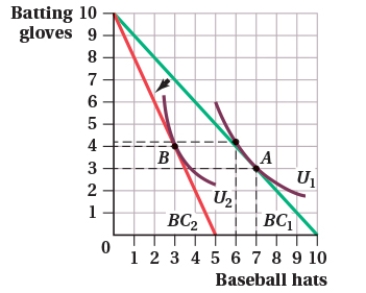
Free
(Multiple Choice)
4.8/5  (30)
(30)
Correct Answer: Verified
B
Siti is one of many consumers in the yellow onion market. Which of the following statements is (are) TRUE?
I. Siti's demand curve must have the same slope as that of the market demand curve.
II. Siti's demand curve must be to the right of the market demand curve.
III. Siti's demand curve is either as flat as or flatter than the market demand curve.
Free
(Multiple Choice)
4.8/5 (28)
Correct Answer:Verified
D
(Figure: Black Jack Video Games and Fries III) What is the demand equation? 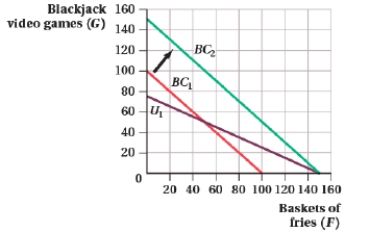
Free
(Essay)
4.8/5 (28)
Correct Answer:Verified
Note the kink at a price of $5 and a quantity of 2 units. This will lead to a two-segment demand curve with price ranges of $5 < P < $10 and P < $5. The segment above $5 will be Q = 4 - 0.4P and below $4 it will be Q = 14 - 2.4P.
(Figure: Beef Jerky and Scallops I) 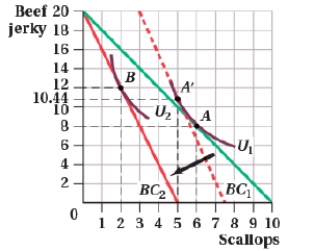 According to the figure, scallops are a (an) ____ good.
(Multiple Choice)
4.8/5 (36)
(Figure: Good Y and Good X II) Which of the following statements are TRUE? 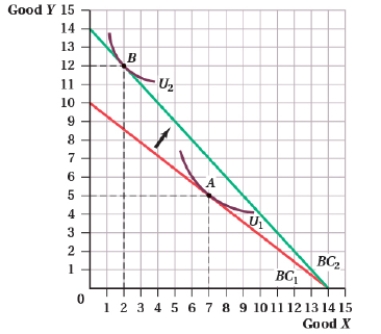 I. The demand curve for good Y shifted outward.
II) The demand curve for good Y shifted inward.
III) The demand curve for good X shifted inward.
IV) The price of good Y decreased, causing an increase in the quantity demanded of good Y.
I. The demand curve for good Y shifted outward.
II) The demand curve for good Y shifted inward.
III) The demand curve for good X shifted inward.
IV) The price of good Y decreased, causing an increase in the quantity demanded of good Y.
(Multiple Choice)
4.9/5 (30)
Julie spends all of her income on gasoline and pizza. Gasoline costs $4 per gallon and pizza costs $2 per slice. When Julie's income is $50 per week, she purchases 5 gallons of gasoline and 15 slices of pizza. When her income rises to $80 per week, she buys 15 gallons of gasoline and 10 slices of pizza. Which of the following statements is true?
(Multiple Choice)
4.8/5 (33)
Suppose that a consumer has utility U(X,Y) = 2XY + X and income of $499 to spend on goods X and Y.
a. The prices of X and Y are $1 and $2 per unit, respectively. Use a Lagrangian to solve for the optimal basket of goods.
b. Suppose that the price of X increases to $2 per unit. Use a Lagrangian to solve for the new optimal basket of goods. Find the total effect of the price change on the consumption of each good.
c. Use a Lagrangian to find the substitution effect of the increase in the price of good X on the consumption of each good. What income would the consumer need to attain the original level of utility if the price of X increased to $2 per unit?
d. Find the income effect of the increase in the price of good X on the consumption of each good. Are the goods normal or inferior? Explain.
e. Show that the total effect of the increase in the price of X is equal to the sum of the substitution effect and the income effect.
(Essay)
4.8/5 (38)
Suppose a consumer spends her income on lobster and frozen pizza. Assume that the consumer has an income of $60, the price of lobster is $6, and the price of frozen pizza is $6.
a. Using indifference curves and budget constraints, show the income and substitution effects associated with a decrease in the price of frozen pizza. Assume frozen pizza is an inferior good and lobster is a normal good.
b. Using indifference curves and budget constraints, show the income and substitution effects associated with a decrease in the price of frozen pizza. Assume frozen pizza is a Giffen good and lobster is a normal good.
(Essay)
4.7/5 (37)
Suppose that there are two goods, X and Y. The utility function is  The price of Y is $2 per unit and the price of X is P. Derive the Hicksian demand curve for X for utility equal to 2,000 units.
(Essay)
4.8/5 (35)
(Figure: Quantity of Good Y and X IV) The price of good Y decreased from $20 to $10.  Goods X and Y are considered ____.
(Multiple Choice)
4.9/5 (30)
Suppose that there are two goods, X and Y. The utility function is U = XY + 2Y. The price of X is P, and the price of Y is $5. Income is $60. The demand for X as a function of P is X = ____.
(Multiple Choice)
4.8/5 (40)
To use calculus to decompose the total effect of a price change into substitution and income effects, it is necessary to solve all of the following EXCEPT the consumer's:
(Multiple Choice)
4.8/5 (39)
Eidi has $100 to spend on video blackjack at $1 per game and French fries at $1 per basket.
Graph Eidi's budget constraint, putting video games on the vertical axis and French fries on the horizontal axis. Using an indifference curve, show Eidi's optimal consumption bundle at 20 blackjack games and 80 baskets of fries.
(Essay)
4.7/5 (40)
(Figure: Quantity of Good Y and X IV) The price of good Y decreased from $20 to $10. 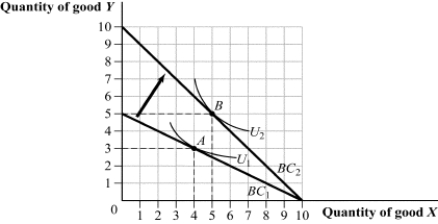 The cross-price elasticity of demand for good X with respect to good Y is ____.
(Multiple Choice)
4.9/5 (33)
(Figure: Beef Jerky and Scallops I)  According to the figure, the substitution effect associated with the increase in the price of scallops is a movement from ____ to _____ scallops.
(Multiple Choice)
4.8/5 (29)
Which of the following statements about Hicksian demand curves is FALSE?
(Multiple Choice)
4.8/5 (33)
Yasmine has $40 weekly to spend on restaurant meals (priced at $10 per meal) and bowling (priced at $2 per game).
a. Graph Yasmine's budget constraint, placing restaurant meals on the vertical axis and bowling games on the horizontal axis. Illustrate Yasmine's optimal consumption bundle, composed of 1 restaurant meal and 15 games of bowling.
b. Suppose that the price of bowling increases to $4 per game. Illustrate Yasmine's new budget constraint along with her new optimal consumption bundle, composed of 2 restaurant meals and 5 games of bowling.
c. Draw Yasmine's demand curve for bowling, indicating her quantities demanded at $2 and $4.
(Essay)
4.9/5 (37)
(Figure: Good Y and Good X V) In panel (a), the price of good X is $1.50 per unit and the price of good Y is $3 per unit. In panel (b), the consumer's income increased from $400 to $480.
Panel (a) Panel (b) 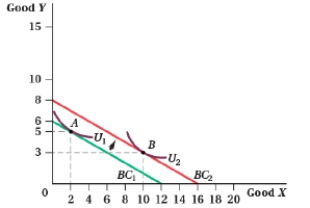
 Using panel (b), good X is a (an) _____ good.
(Multiple Choice)
5.0/5 (44)
(Figure: Books and Paintings I) Which of the following statements is TRUE? 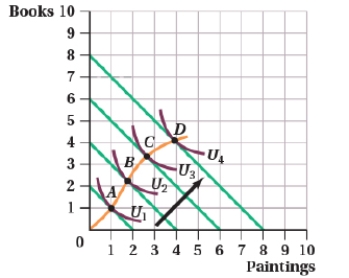
(Multiple Choice)
4.8/5 (44)
Suppose that there are two goods, X and Y. The utility function is  The price of Y is $1 per unit and the price of X is P. Derive the Hicksian demand curve for X for utility equal to 50,000 units.
(Essay)
4.7/5 (38)
Filters
- Essay(0)
- Multiple Choice(0)
- Short Answer(0)
- True False(0)
- Matching(0)