Exam 13: Factor Markets
Exam 1: Adventures in Microeconomics20 Questions
Exam 2: Supply and Demand148 Questions
Exam 3: Using Supply and Demand to Analyze Markets146 Questions
Exam 4: Consumer Behavior130 Questions
Exam 5: Individual and Market Demand146 Questions
Exam 6: Producer Behavior142 Questions
Exam 7: Costs179 Questions
Exam 8: Supply in a Competitive Market148 Questions
Exam 9: Market Power and Monopoly162 Questions
Exam 10: Market Power and Pricing Strategies165 Questions
Exam 11: Imperfect Competition172 Questions
Exam 12: Game Theory170 Questions
Exam 13: Factor Markets94 Questions
Exam 14: Investment, Time, and Insurance117 Questions
Exam 15: General Equilibrium97 Questions
Exam 16: Asymmetric Information106 Questions
Exam 17: Externalities and Public Goods114 Questions
Exam 18: Behavioral and Experimental Economics112 Questions
Select questions type
A pizza shop's marginal product of labor, measured as the number of pizzas delivered per week, is MPl = 55 - 5L, where L is the number of workers. The current average price of a pizza in this highly competitive market is $10. The shop, a monopsonist, faces labor supply of W = 100 + 40l, where W is the wage per week and L is the number of workers. The pizza shop will hire ____ workers when the price of a pizza is $10.
Free
(Multiple Choice)
4.7/5  (39)
(39)
Correct Answer: Verified
B
(Figure: Marginal Productivity of Apple Pickers I) Assume that there is a decrease in the wage paid to apple pickers. Which graph best illustrates this change? 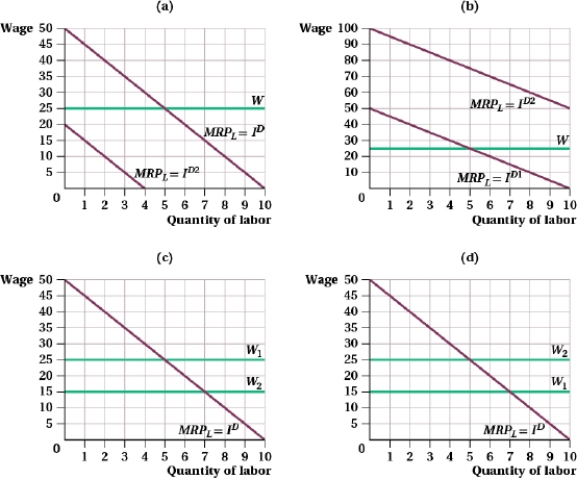
Free
(Multiple Choice)
4.9/5 (37)
Correct Answer:Verified
B
A firm sells bagels for 50 cents each. With 10 workers the firm produces 100 dozen per hour, and with 12 workers it produces 123 dozen per hour. If the firm has 12 workers at the competitive equilibrium, the workers are earning $____ per hour assuming an average 8-hour shift per worker.
Free
(Multiple Choice)
4.8/5 (33)
Correct Answer:Verified
A
(Figure: Labor Union Wages II) The figure represents a labor union with wage in dollars and quantity of labor in hundreds of hours. If the labor union chooses to maximize profit, the deadweight loss will be: 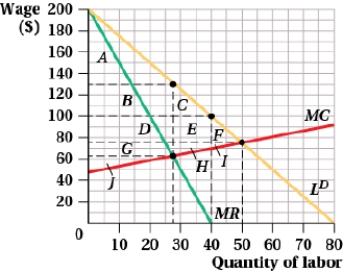
(Multiple Choice)
4.8/5 (35)
(Table: Short-run Production Function I) The table shows the short-run production function for a competitive firm. 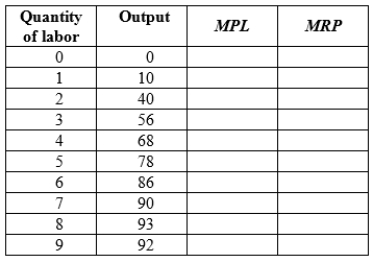 Assuming the firm sells its output for $20 per unit and workers earn a market wage of $160 per day, the firm should hire ____ workers.
(Multiple Choice)
4.8/5 (23)
Suppose the demand faced by a labor monopsony is W = 20,000 - 50l, where W is the annual wage and l is the number of workers hired. The labor supply is given by W = 5,000 + 75l. How many workers will the firm hire?
(Multiple Choice)
4.8/5 (36)
(Figure: Marginal Productivity of Apple Pickers I) Assume that the marginal productivity of apple pickers has increased. Which graph best illustrates this change? 
(Multiple Choice)
4.9/5 (33)
Table (Baristas Labor I). Suppose that the wage rate for baristas is $12 per hour and the average price of cappuccino is $9. 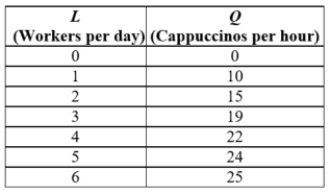 The profit-maximizing quantity of labor is ____.
(Multiple Choice)
4.8/5 (44)
(Table: Short-run Production Function I) The table shows the short-run production function for a competitive firm.  Assuming the firm sells its output for $20 per unit and workers earn a market wage of $80 a day, the firm should hire ____ workers.
(Multiple Choice)
4.9/5 (37)
Table (Baristas Labor I). Suppose that the wage rate for baristas is $9 per hour and the average price of cappuccino is $3.  The profit-maximizing quantity of labor is ____.
(Multiple Choice)
4.7/5 (35)
The government offers subsidies to homeowners for the purchase and installation of solar energy generating equipment. Given that silicon (derived from silicate minerals) is the main input in the production of solar panels, how will the subsidy affect the market for silicon?
(Multiple Choice)
4.8/5 (31)
(Figure: Budget Constraints and Indifference Curves I) The figure shows budget constraints and indifference curves for a representative individual. Identify the substitution effect of the increase in the wage rate in the associated graph. 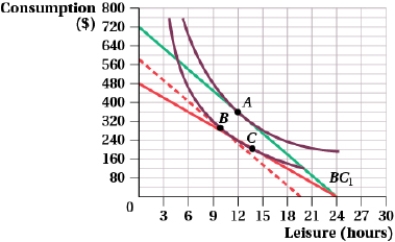
(Multiple Choice)
4.9/5 (24)
(Figure: Marginal Productivity of Apple Pickers I) There is a decrease in total factor productivity. Which graph best illustrates this change? 
(Multiple Choice)
4.9/5 (37)
(Table: Labor Hours Supplied I) The table shows the number of labor hours supplied per worker for various hourly wage rates. 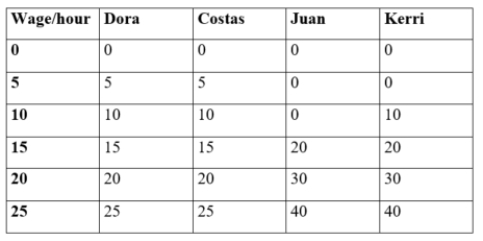 The correct market-level labor supply curve is:
(Multiple Choice)
4.8/5 (33)
(Figure: Labor Union Wages I) The figure represents a labor union with wage in dollars and quantity of labor in hundreds of hours. 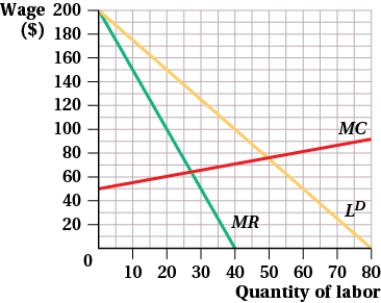 If the labor union chooses to maximize total wages, how many workers will it supply?
(Multiple Choice)
4.8/5 (37)
A union faces a labor demand curve given by MRPL = 100 - 5L. If the union wishes to maximize the total wages of its membership, ____ members will be employed.
(Multiple Choice)
4.8/5 (30)
If a monopsony faces an elasticity of labor supply of 3 and a marginal expenditure of $120, it will offer a wage of:
(Multiple Choice)
4.8/5 (30)
A pizza shop's marginal product of labor, measured as the number of pizzas delivered per week, is MPl = 55 - 5L, where L is the number of workers. The current average price of a pizza in this highly competitive market is $10. The shop, a monopsonist, faces labor supply of W = 100 + 40l, where W is the wage per week and L is the number of workers.
a. How many workers will the pizza shop hire when the price of a pizza is $10?
b. An influx of college students coming back from vacation raises the market price of a pizza to $15. How many workers will the pizza shop hire when the price of a pizza is $15?
(Essay)
4.8/5 (37)
(Figure: Budget Constraint I) If Aleksandra was getting paid $20 per hour, then received a raise of $10 per hour, which graph would best illustrate her new budget constraint? 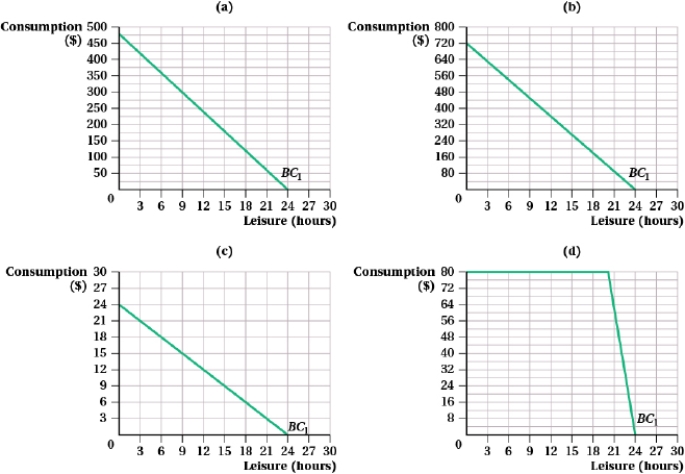
(Multiple Choice)
4.8/5 (38)
Filters
- Essay(0)
- Multiple Choice(0)
- Short Answer(0)
- True False(0)
- Matching(0)