Exam 1: Getting Started
Exam 1: Getting Started138 Questions
Exam 2: The Australian and Global Economies84 Questions
Exam 3: The Economic Problem109 Questions
Exam 4: Demand and Supply139 Questions
Exam 5: GDP: a Measure of Total Production and Income67 Questions
Exam 6: Jobs and Unemployment69 Questions
Exam 7: The Cpi and the Cost of Living67 Questions
Exam 8: Economic Growth71 Questions
Exam 9: Finance, Saving and Investment79 Questions
Exam 10: Money, the Price Level and Inflation107 Questions
Exam 11: Aggregate Supply and Aggregate Demand88 Questions
Exam 12: Aggregate Expenditure Multiplier97 Questions
Exam 13: The Short-Run Policy Tradeoff69 Questions
Exam 14: Fiscal Policy76 Questions
Exam 15: Monetary Policy53 Questions
Exam 16: International Trade Policy63 Questions
Exam 17: International Finance74 Questions
Select questions type
The question 'should economics majors or sociology majors earn more after they graduate?' is an example of a ________ question.
(Multiple Choice)
4.8/5  (41)
(41)
Which of the following is a topic studied in macroeconomics?
(Multiple Choice)
4.9/5 (42)
Whether a company produces fishing rods mostly by hand or using high-tech machinery is a question of
(Multiple Choice)
4.8/5 (33)
In making your decision whether to spend a week on the Gold Coast during the mid-semester break, you compare all the other activities you could undertake. As a result, you
(Multiple Choice)
4.7/5 (32)
Which of the following is the best example of a 'what?' question?
(Multiple Choice)
4.8/5 (39)
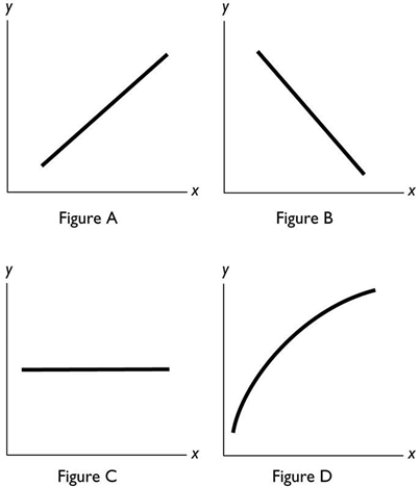 In the above figure, which of the figures show a relationship between x and y with a positive slope?
(Multiple Choice)
4.8/5 (31)
 -In the figure above, ceteris paribus, an increase in x is associated with
(Multiple Choice)
4.8/5 (39)
Your economics lecturer offers 10 bonus marks on the final exam if you attend a review session before the exam. These bonus marks are an example of
(Multiple Choice)
4.7/5 (37)
When an AFL player earns more than a police officer, society answers the ________ question.
(Multiple Choice)
4.9/5 (31)
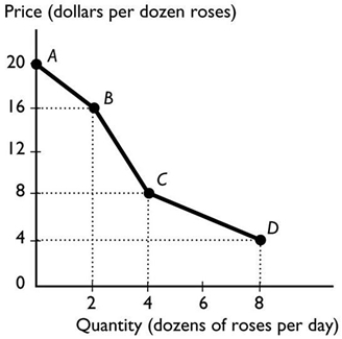 -The figure above shows the relationship between the price of a dozen roses and the quantity of roses a florist can sell. The relationship between the price and the quantity the florist can sell is
(Multiple Choice)
4.9/5 (38)
A graph of the value of one variable against the value of another variable is known as a:
(Multiple Choice)
4.9/5 (41)
Normative statements
i. describe how the world is.
ii. describe how the world ought to be.
iii. depend on people's values and cannot be tested.
(Multiple Choice)
4.8/5 (42)
You have data for the amount of rainfall in 50 cities for the month of June. The type of graph to best display these data would be a
(Multiple Choice)
4.9/5 (42)
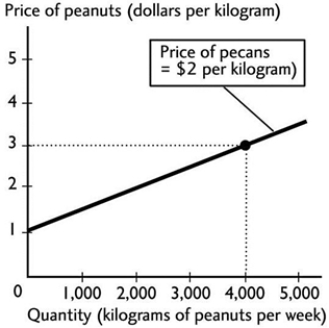 -The above figure shows how many kilograms of peanuts farmers are willing to sell at different prices per kilogram of peanuts. If the price of a kilogram of peanuts is $1 and the price of a kilogram of pecans is $2, peanut farmers are willing to sell
(Multiple Choice)
4.8/5 (34)
Filters
- Essay(0)
- Multiple Choice(0)
- Short Answer(0)
- True False(0)
- Matching(0)