Exam 1: Getting Started
Exam 1: Getting Started138 Questions
Exam 2: The Australian and Global Economies84 Questions
Exam 3: The Economic Problem109 Questions
Exam 4: Demand and Supply139 Questions
Exam 5: GDP: a Measure of Total Production and Income67 Questions
Exam 6: Jobs and Unemployment69 Questions
Exam 7: The Cpi and the Cost of Living67 Questions
Exam 8: Economic Growth71 Questions
Exam 9: Finance, Saving and Investment79 Questions
Exam 10: Money, the Price Level and Inflation107 Questions
Exam 11: Aggregate Supply and Aggregate Demand88 Questions
Exam 12: Aggregate Expenditure Multiplier97 Questions
Exam 13: The Short-Run Policy Tradeoff69 Questions
Exam 14: Fiscal Policy76 Questions
Exam 15: Monetary Policy53 Questions
Exam 16: International Trade Policy63 Questions
Exam 17: International Finance74 Questions
Select questions type
Your lecturer changes the penalty for cheating on exams from getting a 0 on the exam to getting an F in the course. Your lecturer has
(Multiple Choice)
4.8/5  (38)
(38)
Choices that are best for the society as a whole are choices in pursuit of
(Multiple Choice)
4.9/5 (35)
'Lower ticket prices would lead to more people attending football games.' This statement is a:
(Multiple Choice)
4.8/5 (32)
Which of the following is an example of a normative statement?
(Multiple Choice)
4.8/5 (35)
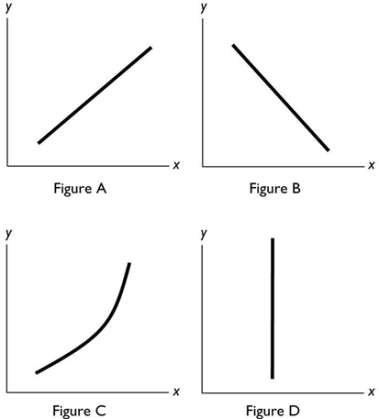 -In the diagram above, which figure(s) show(s) no relationship between the variables?
(Multiple Choice)
4.9/5 (33)
Economics is best defined as the social science that studies
(Multiple Choice)
4.9/5 (33)
A graph shows the price of a kilo of cucumbers on the vertical axis and the quantity of new cars sold by Honda on the horizontal axis. The price of a kilo of cucumbers remains constant as the quantity of new cars sold increases. The graph of these data is a
(Multiple Choice)
4.9/5 (35)
In examining two variables, we find that as one variable changes, the other changes. These variables are said to be
(Multiple Choice)
4.8/5 (36)
To show how a variable ________, we typically use a ________.
(Multiple Choice)
4.8/5 (37)
A graph shows the average ATAR scores for males and females in 20192. The kind of graph used to show these data would be a
(Multiple Choice)
4.9/5 (36)
The statement that 'increases in the tax on petrol increase the price of petrol' is an example of which of the following?
(Multiple Choice)
4.8/5 (32)
Which of the following statements best describes the study of economics?
(Multiple Choice)
4.7/5 (33)
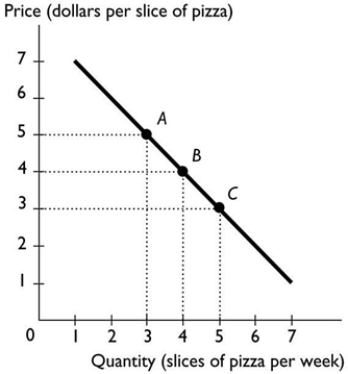 -The above figure shows the relationship between the price of a slice of pizza and how many slices of pizza Ricardo buys in a week. Between points A and B, the slope of the line is ________ the slope of the line between points B and C.
(Multiple Choice)
4.9/5 (39)
As the number of days without rain increases, the amount of wheat grown per acre declines. A graph showing this relationship shows
(Multiple Choice)
4.8/5 (37)
A graph shows that the number of Australian tourists visiting a Caribbean island increases as the temperature in southern Australia falls. The graph shows
(Multiple Choice)
4.9/5 (34)
Which of the following is a microeconomic topic?
i. K-Mart's decision to close stores that are not making a profit.
ii. Bunning's choice to hire more full-time employees because its sales increased.
iii. Virgin Airlines changes its fares.
(Multiple Choice)
4.9/5 (43)
Filters
- Essay(0)
- Multiple Choice(0)
- Short Answer(0)
- True False(0)
- Matching(0)