Exam 1: Getting Started
Exam 1: Getting Started138 Questions
Exam 2: The Australian and Global Economies84 Questions
Exam 3: The Economic Problem109 Questions
Exam 4: Demand and Supply139 Questions
Exam 5: GDP: a Measure of Total Production and Income67 Questions
Exam 6: Jobs and Unemployment69 Questions
Exam 7: The Cpi and the Cost of Living67 Questions
Exam 8: Economic Growth71 Questions
Exam 9: Finance, Saving and Investment79 Questions
Exam 10: Money, the Price Level and Inflation107 Questions
Exam 11: Aggregate Supply and Aggregate Demand88 Questions
Exam 12: Aggregate Expenditure Multiplier97 Questions
Exam 13: The Short-Run Policy Tradeoff69 Questions
Exam 14: Fiscal Policy76 Questions
Exam 15: Monetary Policy53 Questions
Exam 16: International Trade Policy63 Questions
Exam 17: International Finance74 Questions
Select questions type
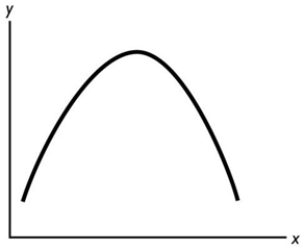 In the figure above, the relationship between the x variable and the y variable
(Multiple Choice)
4.7/5  (37)
(37)
When the Adelaide Crows score more than 100 points in a home game, they win the game. This is an example of
(Multiple Choice)
4.8/5 (41)
Demonstrating how an economic variable changes from one year to the next is best illustrated by a
(Multiple Choice)
4.8/5 (42)
Matthew has eaten two hamburgers and is considering a third. The marginal benefit in his decision is the pleasure from consuming
(Multiple Choice)
4.8/5 (46)
A curve with a positive but decreasing slope represents a relationship where, every time the variable measured along the horizontal axis increases by one unit, the variable measured along the vertical axis
(Multiple Choice)
4.8/5 (34)
In order to determine whether to major in economics, a rational individual compares the ________ of the decision.
(Multiple Choice)
4.7/5 (38)
Australia has a universal health care system called Medicare, so that everyone, regardless of their ability to pay, has some access to health care. Based on this observation, Australia has decided that 'everyone, regardless of their ability to pay' is the answer to what microeconomic question?
(Multiple Choice)
4.8/5 (38)
When Tesla decides to increase production of electric cars, it directly answers the ________ question.
(Multiple Choice)
4.7/5 (32)
Matt pays a $50 a month membership fee at Bruno's Gym. He can exercise at the gym as many times as he wishes. If the membership fee is measured along the vertical axis and the number of times he exercises is measured along the horizontal axis, the graph between his membership fee and the number of times he exercises will
(Multiple Choice)
4.9/5 (28)
Filters
- Essay(0)
- Multiple Choice(0)
- Short Answer(0)
- True False(0)
- Matching(0)