Exam 1: Getting Started
Exam 1: Getting Started138 Questions
Exam 2: The Australian and Global Economies84 Questions
Exam 3: The Economic Problem109 Questions
Exam 4: Demand and Supply139 Questions
Exam 5: GDP: a Measure of Total Production and Income67 Questions
Exam 6: Jobs and Unemployment69 Questions
Exam 7: The Cpi and the Cost of Living67 Questions
Exam 8: Economic Growth71 Questions
Exam 9: Finance, Saving and Investment79 Questions
Exam 10: Money, the Price Level and Inflation107 Questions
Exam 11: Aggregate Supply and Aggregate Demand88 Questions
Exam 12: Aggregate Expenditure Multiplier97 Questions
Exam 13: The Short-Run Policy Tradeoff69 Questions
Exam 14: Fiscal Policy76 Questions
Exam 15: Monetary Policy53 Questions
Exam 16: International Trade Policy63 Questions
Exam 17: International Finance74 Questions
Select questions type
John has two hours of free time this evening. He ranked his alternatives, first go to a concert, second go to a movie, third study for an economics exam, and fourth answer his email. What is the opportunity cost of attending the concert for John?
(Multiple Choice)
4.7/5  (36)
(36)
If the quantity of the variable on the y-axis increases by 10 when the quantity of the variable on the x-axis decreases by 2, then the slope of the curve equals
(Multiple Choice)
4.7/5 (42)
When two variables in a graph are related to a third, changing the third causes
(Multiple Choice)
4.8/5 (38)
You have chosen to take a trip during the mid-semester break. If you had not gone, you would either have worked at a temporary job or studied for exams. The opportunity cost of your trip is
(Multiple Choice)
4.8/5 (42)
By donating $1,000 to the Salvation Army, Caroline reduced her taxable income. To Caroline, the reduction in her taxable income is
(Multiple Choice)
4.8/5 (32)
With y measured on the vertical axis and x measured on the horizontal axis, the slope of a straight line is defined as
(Multiple Choice)
4.8/5 (38)
 In the above, which figures show a relationship between the variables that is always negative?
(Multiple Choice)
4.8/5 (32)
A graph shows the wage rate of factory workers. The slope of the line is positive for periods when the wage rate is
(Multiple Choice)
4.9/5 (31)
When a home builder decides to computerise all of his production schedule, it directly answers the ________ question.
(Multiple Choice)
4.8/5 (39)
If the marginal benefit of the next slice of pizza exceeds the marginal cost, you will
(Multiple Choice)
4.9/5 (38)
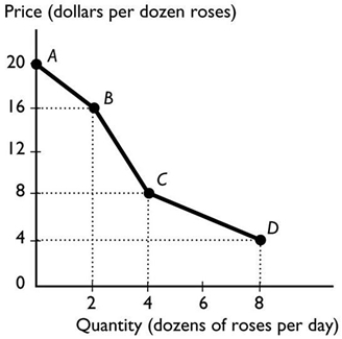 -The figure above shows the relationship between the price of a dozen roses and the quantity of roses a florist can sell. The slope between points B and C equals
(Multiple Choice)
4.8/5 (34)
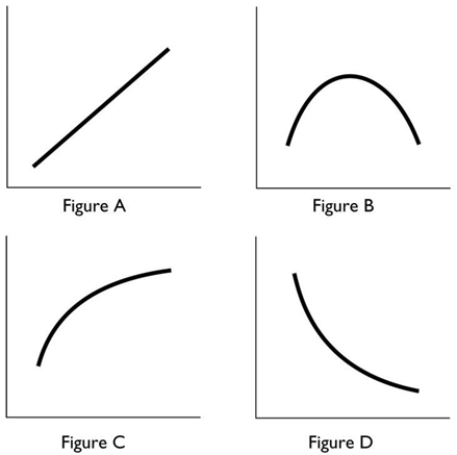 In the above, which figures show a relationship between the variables that is always positive?
(Multiple Choice)
4.8/5 (37)
-The figure above shows the relationship between the price of a dozen roses and the quantity of roses a florist can sell. The slope between points C and D equals
(Multiple Choice)
4.7/5 (38)
Filters
- Essay(0)
- Multiple Choice(0)
- Short Answer(0)
- True False(0)
- Matching(0)