Exam 1: Getting Started
Exam 1: Getting Started138 Questions
Exam 2: The Australian and Global Economies84 Questions
Exam 3: The Economic Problem109 Questions
Exam 4: Demand and Supply139 Questions
Exam 5: GDP: a Measure of Total Production and Income67 Questions
Exam 6: Jobs and Unemployment69 Questions
Exam 7: The Cpi and the Cost of Living67 Questions
Exam 8: Economic Growth71 Questions
Exam 9: Finance, Saving and Investment79 Questions
Exam 10: Money, the Price Level and Inflation107 Questions
Exam 11: Aggregate Supply and Aggregate Demand88 Questions
Exam 12: Aggregate Expenditure Multiplier97 Questions
Exam 13: The Short-Run Policy Tradeoff69 Questions
Exam 14: Fiscal Policy76 Questions
Exam 15: Monetary Policy53 Questions
Exam 16: International Trade Policy63 Questions
Exam 17: International Finance74 Questions
Select questions type
What typically happens to benefits as the amount of an activity is increased?
(Multiple Choice)
4.8/5  (38)
(38)
On a graph showing the relationship between x and y, the ceteris paribus condition implies that
(Multiple Choice)
4.8/5 (46)
A normative statement:
i. can be tested as to whether it is true or false.
ii. is considered negative.
iii. depends on a person's values.
(Multiple Choice)
4.9/5 (35)
Which economic question depends on the incomes that people earn and the prices they pay for goods and services?
(Multiple Choice)
4.9/5 (33)
Suppose that, instead of taking this test, you could either have worked and earned income or partied and had a pleasurable time. Your opportunity cost of taking the test is the
(Multiple Choice)
4.8/5 (45)
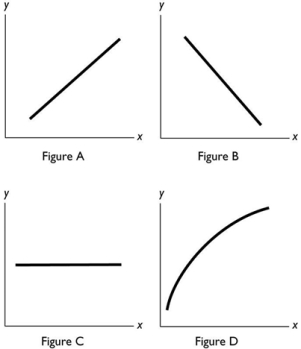 In the above figure, which of the figures show a relationship between x and y with a negative slope?
(Multiple Choice)
4.8/5 (35)
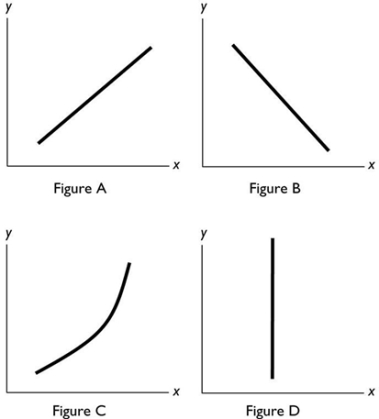 -In the diagram above, which figure(s) show(s) an inverse relationship between the variables?
(Multiple Choice)
4.8/5 (41)
When an electricity distribution company decides to use manpower to bury its lines, it directly answers the ________ question.
(Multiple Choice)
4.9/5 (31)
A positive statement:
i. makes a statement about how the world operates.
ii. is a true statement.
iii. can be tested against the facts.
(Multiple Choice)
4.9/5 (34)
A graph showing the values of an economic variable for different groups in a population at a point in time is called a
(Multiple Choice)
4.8/5 (31)
When Gabriel made a rational choice to spend his entire allowance on chocolate bars, he did so by comparing the
(Multiple Choice)
4.7/5 (29)
Jamie has enough money to buy either a Mountain Dew, a Pepsi, or a bag of chips. He chooses to buy the Mountain Dew. The opportunity cost of the Mountain Dew is
(Multiple Choice)
4.9/5 (28)
You have data for sales of pizza for each Australian state in 20191. The type of graph to best display these data would be a
(Multiple Choice)
4.9/5 (34)
Filters
- Essay(0)
- Multiple Choice(0)
- Short Answer(0)
- True False(0)
- Matching(0)