Exam 7: Production, Inputs, and Cost: Building Blocks for Supply Analysis
Exam 1: What Is Economics254 Questions
Exam 2: The Economony: Myth and Reality184 Questions
Exam 3: The Fundamental Economic Problem: Scarcity and Choice278 Questions
Exam 4: Supply and Demand: an Initial Look297 Questions
Exam 5: Consumer Choice: Individual and Market Demand213 Questions
Exam 6: Demand and Elasticity247 Questions
Exam 7: Production, Inputs, and Cost: Building Blocks for Supply Analysis246 Questions
Exam 8: Output, Price, and Profit: the Importance of Marginal Analysis232 Questions
Exam 9: The Financial Markets and the Economy: the Tail That Wags the Dog225 Questions
Exam 10: The Firm and the Industry Under Perfect Competition219 Questions
Exam 11: The Case for Free Markets: the Price System251 Questions
Exam 12: Monopoly236 Questions
Exam 13: Between Competition and Monopoly248 Questions
Exam 14: Limiting Market Power: Antitrust and Regulation152 Questions
Exam 15: The Shortcomings of Free Markets210 Questions
Exam 16: The Economics of the Environment, and Natural Resources218 Questions
Exam 17: Taxation and Resource Allocation218 Questions
Exam 18: Pricing the Factors of Production230 Questions
Exam 19: Labor and Entrepreneurship: the Human Inputs267 Questions
Exam 20: Poverty, Inequality, and Discrimination167 Questions
Exam 21: An Introduction to Macroeconomics212 Questions
Exam 22: The Goals of Macroeconomic Policy212 Questions
Exam 23: Economic Growth: Theory and Policy226 Questions
Exam 24: Aggregate Demand and the Powerful Consumer216 Questions
Exam 25: Demand-Side Equilibrium: Unemployment or Inflation215 Questions
Exam 26: Bringing in the Supply Side: Unemployment and Inflation228 Questions
Exam 27: Managing Aggregate Demand: Fiscal Policy207 Questions
Exam 28: Money and the Banking System222 Questions
Exam 29: Monetary Policy: Conventional and Unconventional208 Questions
Exam 30: The Financial Crisis and the Great Recession64 Questions
Exam 31: The Debate Over Monetary and Fiscal Policy216 Questions
Exam 32: Budget Deficits in the Short and Long Run214 Questions
Exam 33: The Trade-Off Between Inflation and Unemployment218 Questions
Exam 34: International Trade and Comparative Advantage215 Questions
Exam 35: The International Monetary System: Order or Disorder216 Questions
Exam 36: Exchange Rates and the Macroeconomy215 Questions
Exam 37: Contemporary Issues in the Useconomy23 Questions
Select questions type
Whether or not a production process shows economies of scale depends on
(Multiple Choice)
4.8/5  (39)
(39)
Total physical product shows what happens to the quantity of a firm's output when that firm changes the quantity of an input in the production process.
(True/False)
4.9/5 (36)
Some costs cannot be varied within a given time period.These costs are called
(Multiple Choice)
4.8/5 (27)
Diminishing marginal returns explains why a firm's long-run average total cost curve is U shaped.
(True/False)
4.9/5 (36)
Figure 7-5 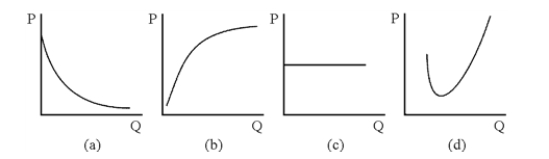 -Which of the graphs in Figure 7-5 could be a firm's total fixed cost curve?
(Multiple Choice)
4.8/5 (44)
An airline industry study recently reported, "Evidence is abundant that larger firms are not more efficient or less costly simply because they are larger.In fact, other things equal, the largest carriers tend to have a higher level of unit costs, possibly caused by the difficulties of managing an airline of large size." This means that
(Multiple Choice)
4.8/5 (30)
The firm can calculate all points on its total cost curve if it knows
(Multiple Choice)
4.9/5 (34)
Figure 7-4 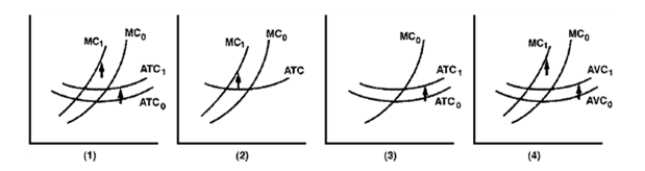 -Average cost curves have the same basic shape as
(Multiple Choice)
4.9/5 (39)
If the MRP per dollar is greater for labor than that for tools, a producer should spend more money on labor than originally planned and less on tools.How long can he continue this switch in spending? Why?
(Essay)
4.8/5 (40)
Economies of scale lead to declining long-run average cost curves.
(True/False)
4.7/5 (36)
The average cost curve shows the total cost divided by quantity produced for various levels of output.
(True/False)
4.9/5 (29)
Table 7-5  -Table 7-5 shows short-run total cost figures for a stereo manufacturer.The short-run average variable cost of producing five stereos is
(Multiple Choice)
4.7/5 (25)
The table below gives data on output for a firm in the short run.The firm is able to hire labor and its TPP is given.Compute the APP, MPP, and MRP for labor if the price of the good is fixed at $12 per unit. 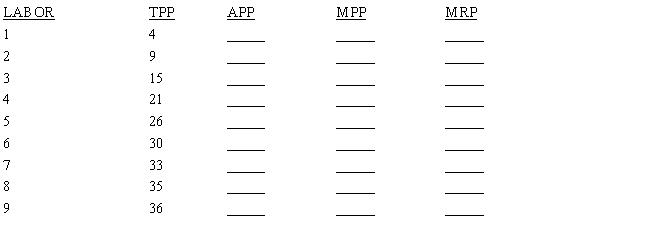
(Essay)
4.9/5 (30)
"If it were not for the law of diminishing marginal returns, the world's wheat could be grown in a flower pot." Explain.
(Essay)
4.8/5 (25)
A firm produces 2,000 high-quality bicycles per year.At this output, AVC $300 and the firm's fixed costs are $200,000.The firm's total costs are
(Multiple Choice)
4.8/5 (35)
A production indifference curve describes the input combinations that will produce a given output.
(True/False)
4.8/5 (34)
Figure 7-2 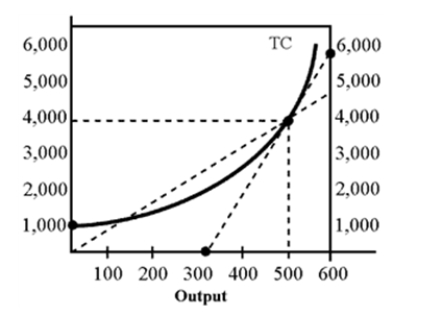 -In Figure 7-2, at an output of 500, marginal cost equals
(Multiple Choice)
4.9/5 (35)
Filters
- Essay(0)
- Multiple Choice(0)
- Short Answer(0)
- True False(0)
- Matching(0)