Exam 7: Production, Inputs, and Cost: Building Blocks for Supply Analysis
Exam 1: What Is Economics254 Questions
Exam 2: The Economony: Myth and Reality184 Questions
Exam 3: The Fundamental Economic Problem: Scarcity and Choice278 Questions
Exam 4: Supply and Demand: an Initial Look297 Questions
Exam 5: Consumer Choice: Individual and Market Demand213 Questions
Exam 6: Demand and Elasticity247 Questions
Exam 7: Production, Inputs, and Cost: Building Blocks for Supply Analysis246 Questions
Exam 8: Output, Price, and Profit: the Importance of Marginal Analysis232 Questions
Exam 9: The Financial Markets and the Economy: the Tail That Wags the Dog225 Questions
Exam 10: The Firm and the Industry Under Perfect Competition219 Questions
Exam 11: The Case for Free Markets: the Price System251 Questions
Exam 12: Monopoly236 Questions
Exam 13: Between Competition and Monopoly248 Questions
Exam 14: Limiting Market Power: Antitrust and Regulation152 Questions
Exam 15: The Shortcomings of Free Markets210 Questions
Exam 16: The Economics of the Environment, and Natural Resources218 Questions
Exam 17: Taxation and Resource Allocation218 Questions
Exam 18: Pricing the Factors of Production230 Questions
Exam 19: Labor and Entrepreneurship: the Human Inputs267 Questions
Exam 20: Poverty, Inequality, and Discrimination167 Questions
Exam 21: An Introduction to Macroeconomics212 Questions
Exam 22: The Goals of Macroeconomic Policy212 Questions
Exam 23: Economic Growth: Theory and Policy226 Questions
Exam 24: Aggregate Demand and the Powerful Consumer216 Questions
Exam 25: Demand-Side Equilibrium: Unemployment or Inflation215 Questions
Exam 26: Bringing in the Supply Side: Unemployment and Inflation228 Questions
Exam 27: Managing Aggregate Demand: Fiscal Policy207 Questions
Exam 28: Money and the Banking System222 Questions
Exam 29: Monetary Policy: Conventional and Unconventional208 Questions
Exam 30: The Financial Crisis and the Great Recession64 Questions
Exam 31: The Debate Over Monetary and Fiscal Policy216 Questions
Exam 32: Budget Deficits in the Short and Long Run214 Questions
Exam 33: The Trade-Off Between Inflation and Unemployment218 Questions
Exam 34: International Trade and Comparative Advantage215 Questions
Exam 35: The International Monetary System: Order or Disorder216 Questions
Exam 36: Exchange Rates and the Macroeconomy215 Questions
Exam 37: Contemporary Issues in the Useconomy23 Questions
Select questions type
Figure 7-15 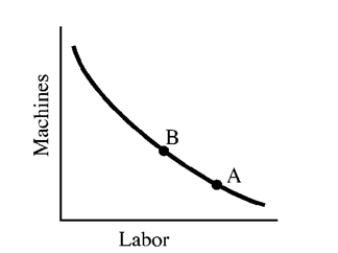 -In Figure 7-15, we would expect a move along the production indifference curve from A to B if
(Multiple Choice)
4.9/5  (36)
(36)
The different points on a cost curve represent alternative production possibilities in the same time period.
(True/False)
4.9/5 (41)
Figure 7-6 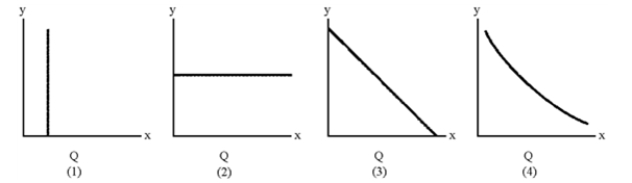 -Which of the lines in Figure 7-6 represents a typical average fixed cost curve?
(Multiple Choice)
4.9/5 (31)
If in some range of production, average cost is falling, the firm is experiencing
(Multiple Choice)
4.9/5 (37)
Table 7-4 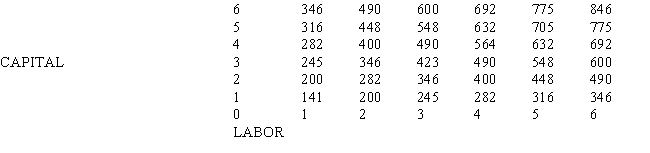
 -To determine total cost, the business owner must know
(Multiple Choice)
4.9/5 (39)
Figure 7-1 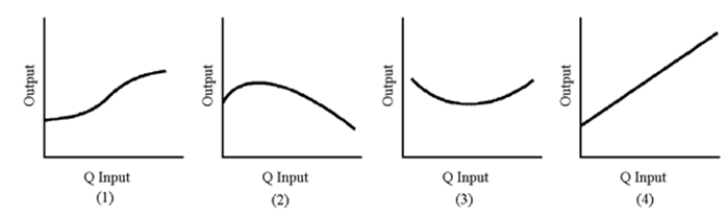 -The "law" of diminishing returns is also referred to as
(Multiple Choice)
4.8/5 (33)
Input proportions are usually fixed by technological conditions alone.
(True/False)
4.8/5 (33)
In the typical AC curve, the downward-sloping part is attributable to
(Multiple Choice)
4.7/5 (25)
If MPPa/Pa > MPPb/Pb, then the proportions of these two inputs is optimal.
(True/False)
4.9/5 (37)
If the MPP of labor is 60 and the price of labor per period is $20, the MPP of machinery is 75, and the price of the machinery per period is $25, in order to achieve optimal input proportions, the firm should use
(Multiple Choice)
4.9/5 (33)
If a firm has increasing returns to scale at all levels of output, the
(Multiple Choice)
4.8/5 (33)
Figure 7-1
-Of the graphs in Figure 7-1, which best represents marginal physical product?
(Multiple Choice)
4.8/5 (33)
Figure 7-13 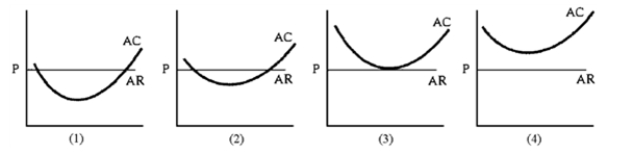 -Figure 7-13 shows the average total cost curves of four firms that produce milk.Some of the dairies are more productive.AR = P is the long-run price of milk.How many of these dairies will remain in the industry in the long run?
(Multiple Choice)
4.8/5 (40)
A firm uses two inputs, A and B.At its optimal choice of input proportions,
(Multiple Choice)
4.7/5 (33)
Table 7-6 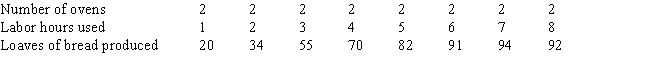 -Table 7-6 shows a baker's daily production relationship for bread.Diminishing returns to labor begin when the baker goes from
(Multiple Choice)
4.9/5 (34)
A change in input prices will change the location of the firm's budget line.
(True/False)
5.0/5 (28)
Filters
- Essay(0)
- Multiple Choice(0)
- Short Answer(0)
- True False(0)
- Matching(0)