Exam 4: Numerical Summary Measures
Exam 1: Why Study Statistics11 Questions
Exam 2: An Introduction to Statistics and Statistical Inference53 Questions
Exam 3: Tables and Graphs for Summarizing Data28 Questions
Exam 4: Numerical Summary Measures34 Questions
Exam 5: Probability54 Questions
Exam 6: Random Variables and Discrete Probability Distributions23 Questions
Exam 7: Continuous Probability Distributions45 Questions
Exam 8: Sampling Distributions50 Questions
Exam 9: Confidence Intervals Based on a Single Sample51 Questions
Exam 10: Hypothesis Tests Based on a Single Sample65 Questions
Exam 11: Confidence Intervals and Hypothesis Tests Based on Two Samples or Treatments45 Questions
Exam 12: The Analysis of Variance12 Questions
Exam 13: Correlation and Linear Regression57 Questions
Exam 14: Categorical Data and Frequency Tables23 Questions
Exam 15: Nonparametric Statistics66 Questions
Select questions type
The IQ curve is normal, with a mean of 100 and a standard deviation of 15.If "normal" IQ is defined as a score within 1 standard deviation of the mean, what range of scores is considered "normal"?
(Multiple Choice)
4.8/5  (41)
(41)
If we have a distribution with ith deviation from the mean equal to 0, then we know that:
(Multiple Choice)
4.8/5 (37)
A personnel manager believes that a particular employee produces more defective parts than his peers.The manager records the worker's production over the course of several weeks.Out of 315 parts produced, 11 are defective.Calculate  (the sample proportion) if we define a defective part as a "success."
(Multiple Choice)
4.9/5 (36)
It is known that the body mass index (BMI) of healthy American females follows a normal distribution, with a mean of 22.5 and a standard deviation pf 3.0.Approximately what percentage of female BMI values fall between 16.5 and 28.5?
(Multiple Choice)
4.8/5 (33)
What is the largest possible value of the sample standard deviation?
(Multiple Choice)
4.9/5 (36)
A conservationist measures the diameters, in centimeters, of 200 white pine trees in the Allegheny National Forest in Northwest Pennsylvania.The data are summarized with the following five-number summary:
Xmin = 18.23, Q1 = 24.29,  = 30.35, Q3 = 36.41, xmax = 42.47
Based on the five-number summary, the overall shape of the tree diameters appears to be:
= 30.35, Q3 = 36.41, xmax = 42.47
Based on the five-number summary, the overall shape of the tree diameters appears to be:
(Multiple Choice)
5.0/5 (38)
The Roller Coaster Database maintains a website (www.rcdb.com) with data on roller coasters around the world.Some of the data recorded include whether the coaster is made of wood or steel and the maximum speed achieved by the coaster, in miles per hour.The box plots display the distributions of speed by type of coaster for 145 roller coasters in the United States as downloaded from the site in November 2003. 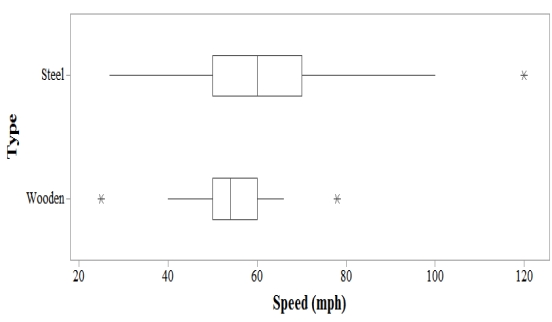 Are there more wooden or steel roller coasters displayed in this plot?
(Multiple Choice)
4.7/5 (35)
The smallest numeric value in a data set subtracted from the largest gives the:
(Multiple Choice)
4.8/5 (33)
The following is an abbreviated list of scores from a recent exam.Which exam score is the 15th percentile? 
(Multiple Choice)
4.8/5 (24)
Filters
- Essay(0)
- Multiple Choice(0)
- Short Answer(0)
- True False(0)
- Matching(0)