Exam 10: Relationships Between Measurement Variables
Exam 1: The Benefits and Risks of Using Statistics30 Questions
Exam 2: Reading the News50 Questions
Exam 3: Measurements, Mistakes, and Misunderstandings44 Questions
Exam 4: How to Get a Good Sample60 Questions
Exam 5: Experiments and Observational Studies60 Questions
Exam 6: Getting the Big Picture22 Questions
Exam 7: Summarizing and Displaying Measurement Data54 Questions
Exam 8: Bell-Shaped Curves and Other Shapes34 Questions
Exam 9: Plots, Graphs, and Pictures57 Questions
Exam 10: Relationships Between Measurement Variables35 Questions
Exam 11: Relationships Can Be Deceiving36 Questions
Exam 12: Relationships Between Categorical Variables36 Questions
Exam 13: Statistical Significance for 2 2 Tables33 Questions
Exam 14: Understanding Probability and Long-Term Expectations42 Questions
Exam 15: Understanding Uncertainty Through Simulation13 Questions
Exam 16: Psychological Influences on Personal Probability30 Questions
Exam 17: When Intuition Differs From Relative Frequency30 Questions
Exam 18: Understanding the Economic News23 Questions
Exam 19: The Diversity of Samples From the Same Population49 Questions
Exam 20: Estimating Proportions With Confidence31 Questions
Exam 21: The Role of Confidence Intervals in Research40 Questions
Exam 22: Rejecting Chancetesting Hypotheses in Research43 Questions
Exam 23: Hypothesis Testingexamples and Case Studies25 Questions
Exam 24: Significance, Importance, and Undetected Differences38 Questions
Exam 25: Meta-Analysis: Resolving Inconsistencies Across Studies23 Questions
Exam 26: Ethics in Statistical Studies29 Questions
Exam 27: Putting What You Have Learned to the Test46 Questions
Select questions type
Suppose the correlation between two measurement variables is −1.Which of the following statements is not true?
(Multiple Choice)
4.9/5  (42)
(42)
Which of the following is true if a relationship is found to be statistically significant?
(Multiple Choice)
4.8/5 (40)
For Questions , use the following narrative
Narrative: Study time and exam score
Suppose an algebra professor found that the correlation between study time (in hours) and exam score (out of 100) is +.80, and the regression line was found to be y = 20 + 4x.He arrived at this equation through years of collecting data on his students, most of whom reported studying anywhere from 0 to 20 hours for his exams.
-{Study time and exam score narrative} What meaning (if any) does the slope of 4 have in this situation? Use words that a non-statistics student would be able to understand.
(Essay)
4.8/5 (33)
Which of the following is a correct interpretation of a correlation?
(Multiple Choice)
4.9/5 (34)
Determine whether or not the following statement could be statistically correct.If not, explain why not."The correlation between tree diameter and weight of fruit harvested was found to be 2.3."
(Essay)
4.9/5 (44)
For Questions , use the following narrative
Narrative: Study time and exam score
Suppose an algebra professor found that the correlation between study time (in hours) and exam score (out of 100) is +.80, and the regression line was found to be y = 20 + 4x.He arrived at this equation through years of collecting data on his students, most of whom reported studying anywhere from 0 to 20 hours for his exams.
-{Study time and exam score narrative} In order to get a 100 on this exam, how long should students expect to study (minimum)?
(Essay)
4.9/5 (38)
Suppose a researcher examined 100 possible relationships between the different measurement variables in her study, and found five of them to be statistically significant.Would these five statistically significant relationships have been more, less, or equally meaningful if they had been the only five relationships that were examined in her study?
(Essay)
4.8/5 (39)
Which of the following describes a strong statistical correlation?
(Multiple Choice)
4.8/5 (44)
Correlation measures the strength of a certain type of statistical relationship between two variables.What type(s) of variables can the two variables be?
(Essay)
4.9/5 (41)
Assuming there is a statistical relationship between height and weight for adult females, which of the following statements is true?
(Multiple Choice)
4.9/5 (38)
Explain why 5% of all relationships that occur by chance alone will erroneously earn the title of being 'statistically significant.'
(Essay)
5.0/5 (40)
Which of the following describes a 'detrended' time series?
(Multiple Choice)
4.9/5 (36)
Determine whether or not the following statement could be statistically correct.If not, explain why not."The correlation between tree diameter and tree height in feet is .69.In yards, this correlation would become .69/3 = .23."
(Essay)
4.8/5 (37)
For Questions , use the following narrative
Narrative: Crickets and temperature
A researcher wants to explore the relationship between cricket chirps and temperature.The following scatterplot shows data collected over a random sample of 8 days.Each day, the temperature was recorded, as well as the number of times a cricket chirped in 15 seconds.The correlation was found to be over .90.The least squares line was found to be Temperature (in Fahrenheit) = 40 + 1.0 × (#Chirps in 15 seconds). 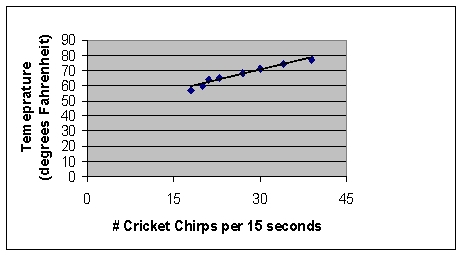 -{Crickets and temperature narrative} For about what range of cricket chirps can the researcher feel comfortable about making temperature predictions?
(Multiple Choice)
4.7/5 (37)
Filters
- Essay(0)
- Multiple Choice(0)
- Short Answer(0)
- True False(0)
- Matching(0)