Exam 9: Plots, Graphs, and Pictures
Exam 1: The Benefits and Risks of Using Statistics30 Questions
Exam 2: Reading the News50 Questions
Exam 3: Measurements, Mistakes, and Misunderstandings44 Questions
Exam 4: How to Get a Good Sample60 Questions
Exam 5: Experiments and Observational Studies60 Questions
Exam 6: Getting the Big Picture22 Questions
Exam 7: Summarizing and Displaying Measurement Data54 Questions
Exam 8: Bell-Shaped Curves and Other Shapes34 Questions
Exam 9: Plots, Graphs, and Pictures57 Questions
Exam 10: Relationships Between Measurement Variables35 Questions
Exam 11: Relationships Can Be Deceiving36 Questions
Exam 12: Relationships Between Categorical Variables36 Questions
Exam 13: Statistical Significance for 2 2 Tables33 Questions
Exam 14: Understanding Probability and Long-Term Expectations42 Questions
Exam 15: Understanding Uncertainty Through Simulation13 Questions
Exam 16: Psychological Influences on Personal Probability30 Questions
Exam 17: When Intuition Differs From Relative Frequency30 Questions
Exam 18: Understanding the Economic News23 Questions
Exam 19: The Diversity of Samples From the Same Population49 Questions
Exam 20: Estimating Proportions With Confidence31 Questions
Exam 21: The Role of Confidence Intervals in Research40 Questions
Exam 22: Rejecting Chancetesting Hypotheses in Research43 Questions
Exam 23: Hypothesis Testingexamples and Case Studies25 Questions
Exam 24: Significance, Importance, and Undetected Differences38 Questions
Exam 25: Meta-Analysis: Resolving Inconsistencies Across Studies23 Questions
Exam 26: Ethics in Statistical Studies29 Questions
Exam 27: Putting What You Have Learned to the Test46 Questions
Select questions type
Which of the following is not true about a plot, graph, or picture of data?
(Multiple Choice)
4.8/5  (29)
(29)
A __________ is like a bar graph except that it uses pictures related to the topic of the graph.
(Short Answer)
4.8/5 (32)
If the scale on the vertical axis is in very large increments with very little space between each one, what does this do to the appearance of the data?
(Multiple Choice)
4.8/5 (33)
Suppose you have data on the number of accidents at a certain inter
(Multiple Choice)
4.9/5 (31)
For Questions use the following narrative
Narrative: Pick 3 lottery
The Kansas Pick 3 Lottery results through 3/15/97 are shown in the table below.In this game, three numbers are drawn each week, and numbers can be repeated (such as 2, 3, 3).
 -{Pick 3 lottery narrative} Using the number of times each number was drawn, display the data in a bar graph that looks as though the number 1 was chosen much less often, and number 2 much more often, than the other numbers.(This will be a misleading graph.) Explain why the lottery chose to display their data in a similar way in their newsletter.
(Essay)
4.9/5 (41)
What type of data situation is best for using a pie chart (discuss type of data and number of variables)?
(Essay)
4.7/5 (35)
Name three basic characteristics that a good plot, graph, or picture of data should exhibit.
(Essay)
4.8/5 (43)
A statistical picture isn't worth much if the __________ can't be trusted.
(Short Answer)
4.7/5 (40)
What characteristics do statistical pictures of measurement data allow us to examine?
(Multiple Choice)
4.7/5 (37)
Which of the following is not true about the plots, graphs, or pictures of data that you come across in the media?
(Multiple Choice)
4.8/5 (39)
Which of the following should be indicated by the labels on a graph?
(Multiple Choice)
4.8/5 (35)
What two things should you check regarding the timeline of a time series in order to avoid being misled?
(Essay)
4.8/5 (33)
If a long-term trend in a time series plot is linear, we can estimate it by finding a regression line, with time period as the __________ variable.
(Short Answer)
4.8/5 (36)
Which of the following components of a time series plot is defined as what's left over when the other three components have been removed?
(Multiple Choice)
4.8/5 (30)
Use the following narrative: Narrative: Lottery dollar. Suppose you came across the following graph in the paper, accompanied by an article on where each dollar spent on lottery tickets goes.
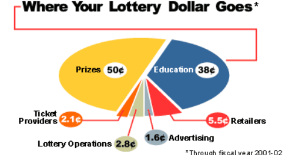 -{Lottery dollar narrative} This graph has a problem, according to the four characteristics that any good graph should have.What is the problem with this graph?
(Essay)
4.8/5 (32)
Filters
- Essay(0)
- Multiple Choice(0)
- Short Answer(0)
- True False(0)
- Matching(0)