Exam 11: Tables
Exam 1: The Nature of Probability and Statistics54 Questions
Exam 2: Frequency Distributions and Graphs83 Questions
Exam 3: Data Description101 Questions
Exam 4: Discrete Probability Distributions79 Questions
Exam 5: The Normal Distribution84 Questions
Exam 6: Confidence Intervals and Sample Size76 Questions
Exam 7: Hypothesis Testing90 Questions
Exam 8: Testing the Difference Between Two Means, Two Proportions, and Two Variances74 Questions
Exam 9: Correlation and Regression83 Questions
Exam 10: Chi-Square and Analysis of Variance Anova71 Questions
Exam 11: Tables71 Questions
Exam 12: Data Bank91 Questions
Exam 13: Glossary68 Questions
Select questions type
A researcher is comparing three groups of the same size. The sample mean of the first group is 14, the sample mean of the second group is 17, and the sample mean of the third group is 20. If the Scheffé F-test
Value for comparing group 1 with group 2 is 5.4, then the Scheffé F-test value for comparing group 1 with
Group 3 will be:
(Multiple Choice)
4.9/5  (44)
(44)
Complete the formula for the sum of squares between groups:
(Multiple Choice)
4.7/5 (32)
An F-test can be used to compare the variances of three or more means.
(True/False)
4.7/5 (40)
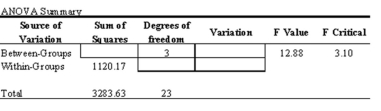
A researcher calculated the ANOVA summary table for an experiment, but accidentally spilled grape juice over the first line of the output. From the data below, calculate the test value
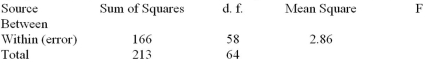
(Multiple Choice)
4.9/5 (35)
A researcher is performing a two-way ANOVA using two factors. The first factor has 4 levels and the second factor also has 4 levels. In the ANOVA Summary Table, the degrees of freedom for the first and
Second factors will be:
(Multiple Choice)
4.8/5 (40)
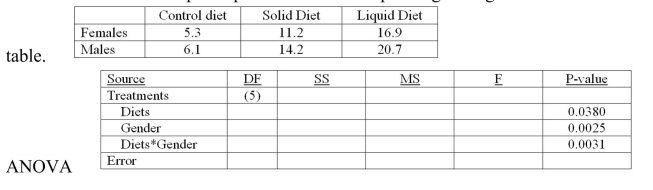
An experiment has been designed to study the effectiveness of a new diet on weight gain for use with
anorexic individuals. The diet is available in both a solid and a liquid form.
The two new diets and a standard control diet were randomly assigned to 15 women and 15 men. Thus,
each of the 3 diets was assigned to 5 men and 5 women. The weight gains attained after 12 weeks were
recorded for each of the participants and the corresponding averages are summarized in the following
 B B'
-The degrees of freedom for error are:
B B'
-The degrees of freedom for error are:
(Multiple Choice)
4.8/5 (38)
A researcher wants to investigate whether there is a significant difference in the average age of instructors, assistant professors, associate professors, and full professors at a university. The faculty members were selected at random and their ages were recorded. Use the collected data to complete the ANOVA chart given below
Raw Data Instructors Assistant Professors Associate Professors Professors 26 28 45 58 32 32 48 56 29 36 52 62 36 45 54 65 40 50 62 52 45 46 65 49
(Essay)
4.9/5 (35)
In the Tukey test, if for a group of size for a group of size , and the within-group variance , then the test value for comparing group 2 to group 4 is:
(Multiple Choice)
4.9/5 (38)
For three groups, the F-test can show whether or not a difference exists among three or more means and
where the difference lies.
(True/False)
4.9/5 (43)
The total number of degrees of freedom for a two-way ANOVA is equal to one less than the total number
of samples.
(True/False)
4.8/5 (29)
A researcher is comparing three groups of the same size. The sample mean of the first group is 11, the sample mean of the second group is 13, and the sample mean of the third group is 15. If the Tukey q-test
Value for comparing group 1 with group 2 is -2.1, then the Tukey q-test value for comparing group 1 with
Group 3 will be:
(Multiple Choice)
4.8/5 (30)
A diet centre wants to test three different methods for losing weight to determine if the average weight loss (reported in pounds/week) for each method is the same. The results for the three methods are given below. Assuming that there is a significant difference between the three methods, use the Tukey test to determine if there is a significant difference between each pair of methods. Let
Liquid Diet Low-Calorie Diet Low-Calorie Diet \& Exercise 5 3 3 2 2 3 1 2 4 2 3 5 3 4 3 4 1 4
(Essay)
4.8/5 (33)
A researcher is comparing three groups of the same size. The sample mean of the first group is 12, the sample mean of the second group is 14, and the sample mean of the third group is 16. If the Tukey q-test
Value for comparing group 1 with group 2 is 2.6, then the Tukey q-test value for comparing group 2 with
Group 3 will be:
(Multiple Choice)
4.8/5 (32)
Assume that the conclusion from an ANOVA is that the null hypothesis is rejected; in other words, the 7 population means (from samples of the same size) are not all equal. We should expect that:
(Multiple Choice)
4.7/5 (38)
A researcher is performing a two-way ANOVA using two factors. The first factor has 4 levels and the second factor has 10 levels. In the ANOVA Summary Table, the degrees of freedom for the interaction
Between the first and second factors will be:
(Multiple Choice)
4.8/5 (41)
If one tested at the 1% level of significance, one would declare that averaging over the 3 diets, weight
gains were significantly different between males and females (i.e., that the main effect of gender is
significant).
(True/False)
4.8/5 (33)
The ______________ test can be used even if the sample sizes are not equal.
________________________________________
(Short Answer)
4.8/5 (35)
A vending machine company wants to check three of its machines to determine if they are properly dispensing 12 ounces of cofee . The data are given below .
Machime A Machune B Mache 11.8 11.7 12.2 12.1 11.9 12.1 12.0 11.7 12.0 11.9 11.8 11.9 12.1 120 12.2
-What is the within-group variance for the three coffee machines?
(Multiple Choice)
4.8/5 (34)
To compare 7 means, which of the following techniques would be applicable?
(Multiple Choice)
4.9/5 (37)
Filters
- Essay(0)
- Multiple Choice(0)
- Short Answer(0)
- True False(0)
- Matching(0)