Exam 2: Frequency Distributions and Graphs
Exam 1: The Nature of Probability and Statistics54 Questions
Exam 2: Frequency Distributions and Graphs83 Questions
Exam 3: Data Description101 Questions
Exam 4: Discrete Probability Distributions79 Questions
Exam 5: The Normal Distribution84 Questions
Exam 6: Confidence Intervals and Sample Size76 Questions
Exam 7: Hypothesis Testing90 Questions
Exam 8: Testing the Difference Between Two Means, Two Proportions, and Two Variances74 Questions
Exam 9: Correlation and Regression83 Questions
Exam 10: Chi-Square and Analysis of Variance Anova71 Questions
Exam 11: Tables71 Questions
Exam 12: Data Bank91 Questions
Exam 13: Glossary68 Questions
Select questions type
If the limits for a class were 20-38, the boundaries would be 19.5-38.5.
Free
(True/False)
4.8/5  (33)
(33)
Correct Answer: Verified
True
In a pie graph, if pepperoni pizza were of the distribution, how many degrees would be needed to represent pepperoni?
Free
(Multiple Choice)
4.8/5 (28)
Correct Answer:Verified
B
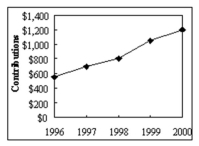
A local fundraiser wants to graphically display the contributions they have received over the past five years. Construct a time series graph for the following
Year Contributions 1996 \ 550 1997 \ 700 1998 \ 800 1999 \ 1050 2000 \ 1200
data.
Free
(Essay)
4.9/5 (38)
Correct Answer:Verified
Year in School Number of Students Freshmen 24 Sophomores 14 Juniors 42 Seniors 17
(Short Answer)
4.7/5 (49)
If data is clustered at one end or the other, it indicates that there is a __________.
(Short Answer)
4.9/5 (36)
Which type of graph represents the data by using vertical bars of various heights to indicate frequencies?
(Multiple Choice)
4.8/5 (32)
Which graph should be used to represent the frequencies that certain types of classes are taken at Sir Robert Borden High School?
(Multiple Choice)
4.9/5 (30)
A pie graph would best represent the number of inches of rain that has fallen in Thunder Bay, Ontario
each day for the past 2 months.
(True/False)
4.8/5 (37)
If a frequency distribution had class boundaries of 132.5-147.5, what would be the class width?
(Short Answer)
4.8/5 (38)
Which of the following should not be done when constructing a frequency distribution?
(Multiple Choice)
4.9/5 (33)
Pareto charts have units that are used for the frequency that are
(Multiple Choice)
4.9/5 (38)
Major Percent of Students Business 47 Science 14 Engineering 44 Social Sciences 8 Liberal Arts 25 Education 19
(Essay)
4.9/5 (40)
Filters
- Essay(0)
- Multiple Choice(0)
- Short Answer(0)
- True False(0)
- Matching(0)