Exam 3: Data Description
Exam 1: The Nature of Probability and Statistics54 Questions
Exam 2: Frequency Distributions and Graphs83 Questions
Exam 3: Data Description101 Questions
Exam 4: Discrete Probability Distributions79 Questions
Exam 5: The Normal Distribution84 Questions
Exam 6: Confidence Intervals and Sample Size76 Questions
Exam 7: Hypothesis Testing90 Questions
Exam 8: Testing the Difference Between Two Means, Two Proportions, and Two Variances74 Questions
Exam 9: Correlation and Regression83 Questions
Exam 10: Chi-Square and Analysis of Variance Anova71 Questions
Exam 11: Tables71 Questions
Exam 12: Data Bank91 Questions
Exam 13: Glossary68 Questions
Select questions type
What is the midrange of the following numbers? 5, 11, 10, 12, 4, 12, 18, 18, 18
Free
(Multiple Choice)
4.7/5  (42)
(42)
Correct Answer: Verified
A
Determine the range for this data: 4, 7, 3, 16, 5, 22, and 8:
Free
(Multiple Choice)
4.8/5 (42)
Correct Answer:Verified
D
The range of the dataset {-3, -7, 2, 14, 0} is
Free
(Short Answer)
4.8/5 (28)
Correct Answer:Verified
21
John, who was a business student, received a grade corresponding to a z-score of 1 whereas his girl friend
who was studying engineering, received a grade corresponding to a z-score of 2. John's grade score was
necessarily below his girl friend's grade
(True/False)
4.8/5 (38)
Compute the sample SD for the data set 1, 2, 3. Now construct a symmetrical dataset of 3 values with
mean 5 and sample SD equal to 1.
(Short Answer)
4.8/5 (36)
The maximum value in a data set is 100 and the minimum value is 20, an approximate value for the standard deviation is
(Multiple Choice)
4.9/5 (41)
Grade Class Boundaries Frequency 89.5-99.5 4 79.5-89.5 7 69.5-79.5 11 59.5-69.5 3 49.5-59.5 3 For the table below, find the 7 percentile.
(Multiple Choice)
4.9/5 (33)
The unbiased estimator is included in the formula for calculating the variance of a sample because
without it, the computed variance usually underestimates the population variance.
(True/False)
4.9/5 (39)
The percentile corresponding to a given value X is computed by adding the 0.5 to number of values below
X and dividing this value by the total number of values within the data set.
(True/False)
4.8/5 (36)
Temperature Frequency 28.5-31.5 1 31.5-34.5 3 34.5-37.5 6 37.5-40.5 10 40.5-43.5 8 43.5-46.5 7 Using the following frequency distribution, find the 4 percentile.
(Multiple Choice)
4.7/5 (41)
Find the median for the following data. 6, 7, 4, 5, 3, 7, 4
(Multiple Choice)
5.0/5 (41)
Grade Class Boundaries Frequency 89.5-99.5 4 79.5-89.5 7 69.5-79.5 11 59.5-69.5 3 49.5-59.5 3 For the table below, calculate the variance
(Multiple Choice)
4.7/5 (36)
Find the mode for the number of police officers in selected city districts. 24, 26, 24, 30, 23, 28, 19, 31, 24, 26, 19
(Multiple Choice)
4.8/5 (30)
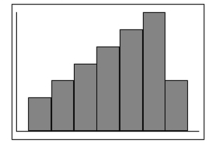
If a distribution is negatively skewed as shown in the figure below, the mean will fall to the right of the median and the mode will be on the left of the median.
(True/False)
4.8/5 (26)
Find the mean, mode, median, and midrange value for the following data set.
12, 15, 18, 18, 15, 22, 15, 30, 12
(Short Answer)
4.9/5 (39)
The grades for a trigonometry exam follow. Find the range. 85, 76, 93, 82, 84, 90, 75
(Multiple Choice)
4.8/5 (30)
If the mean of a set of data is 19.00, and 7.00 has a z-score of -1.50, then the standard deviation must be:
(Multiple Choice)
4.8/5 (38)
Filters
- Essay(0)
- Multiple Choice(0)
- Short Answer(0)
- True False(0)
- Matching(0)