Exam 10: Chi-Square and Analysis of Variance Anova
Exam 1: The Nature of Probability and Statistics54 Questions
Exam 2: Frequency Distributions and Graphs83 Questions
Exam 3: Data Description101 Questions
Exam 4: Discrete Probability Distributions79 Questions
Exam 5: The Normal Distribution84 Questions
Exam 6: Confidence Intervals and Sample Size76 Questions
Exam 7: Hypothesis Testing90 Questions
Exam 8: Testing the Difference Between Two Means, Two Proportions, and Two Variances74 Questions
Exam 9: Correlation and Regression83 Questions
Exam 10: Chi-Square and Analysis of Variance Anova71 Questions
Exam 11: Tables71 Questions
Exam 12: Data Bank91 Questions
Exam 13: Glossary68 Questions
Select questions type
Frequencies obtained by calculation are called expected frequencies.
(True/False)
4.7/5  (35)
(35)
A researcher selected a sample of 50 residents from each of three different cities to determine if citizens were willing to participate in a medical experiment. At , test the claim that the proportions who will participate are equal.
Residents City 1 City 2 City 3 Willing to participate 20 12 26 Not willing to 30 38 24 participate Total 50 50 50
(Multiple Choice)
4.8/5 (44)
A random group of used books was selected from a book warehouse to analyze the books' condition. The book store believes that of the books are in excellent condition, are in very good condition, are in fair condition, and are in poor condition. Is there evidence to reject this hypothesis at = .05 ?
Book condition Excellent Very good Fair Poor Number of books 22 25 19 8
(Multiple Choice)
4.7/5 (35)
Six different brands of popcorn were tested for popping. Two hundred kernels of each brand were popped, and the number of kernels that did not pop was counted. Determine the expected value and then
Brand Number of k 21 plot it on a graph with the observed values. F 13 C 24 D 16 E 12 22
(Short Answer)
5.0/5 (47)
A four-year university has decided to implement a new approach to teaching statistics. Full-time and
adjunct professors were surveyed to determine whether they preferred the traditional lecture approach or
a computer approach for teaching statistics. Use hypothesis testing to test the independence of opinion
between the two groups.
Table 11-3 Prefer Lecture Prefer Computer No Preference Full-time 8 13 6 Adjunct 11 22 10
-What is the test value?
(Multiple Choice)
4.8/5 (41)
A product testing laboratory selected a sample of 20 printers from two different manufacturers to determine if they could print more than 100,000 pages without breaking down. At , test the claim that the proportions of printers from Manufacturer 1 and Manufacturer 2 that lasted for more than
Manufacturer 1 Manufacturer 2 Lasted past 100,000 12 7 Did not last to 100,000 8 13 Total 20 20
(Multiple Choice)
4.9/5 (36)
An insurance representative wants to determine if the proportions of women and men who buy different policy types are the same. The actual sales results for 50 women and 50 men
Policy A Policy B Women 18 32 are: Men 12 38
Under the null hypothesis, what is the expected number of men who would buy Policy B?
(Multiple Choice)
4.7/5 (28)
This table lists the number of students from three different high schools participating in the mathematics and physics sections of a science fair. At , test the claim that the section of participation and the high school where the students were from are
Number of Students High School 1 High School 2 High School 3 Mathematics 9 12 14 independent. Physics 34 27 22
(Multiple Choice)
4.9/5 (42)
A biologist had mice and rats run through a maze and recorded the number that finished the maze successfully and the number that did not. This table lists the results of the study. At , test the claim that the rodent type and the success of finishing the maze are not related
Mice Rats Finished 22 27 Did not Finish 26 16
(Multiple Choice)
4.8/5 (43)
A contingency table is designated as (columns times rows) table.
(True/False)
4.9/5 (35)
The test of independence of variables is used to determine whether two variables are independent of or
related to each other when a single sample is selected.
(True/False)
4.9/5 (35)
A random group of seniors was selected from a university and asked about their plans for the following year. The school advising office claims that of the students plan to work, of the students plan to continue in school, and of the students plan to take some time off. Is there evidence to reject this
Plans Work School Time off hypothesis at =.05? Number of students 22 16 10
(Multiple Choice)
4.9/5 (29)
A random sample of oranges was selected from an orchard to analyze the oranges' ripeness. Based on the time of year, the orchard owner believes that of the oranges are ready for picking now, will be ready in three days, will be ready in one week, and will be ready in two weeks. Is there
Ripeness of oranges Ready Ready in Ready in Ready in two weeks
Number of oranges 10 19 14 16
(Multiple Choice)
4.9/5 (39)
Cattle are classified according to age (young, medium, and old) and carcass quality (grades A, B, and C). In one study, the animals were classified as :
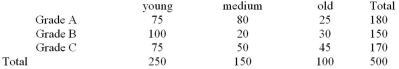 The chi-square statistic for testing if there is an association between age and grade was calculated. The rejection region for this test is (use ):
(Multiple Choice)
4.9/5 (35)
A researcher wishes to determine if there is a relationship between the age of working individuals and the amount of coffee consumed. The following data were obtained for the number of cups of coffee consumed per day:
cups or fewer cups or more Total 35 years 20 5 25 35 or older 19 21 40
Choose the best option from the choices below:
(Multiple Choice)
4.8/5 (31)
A four-year university has decided to implement a new approach to teaching statistics. Full-time and
adjunct professors were surveyed to determine whether they preferred the traditional lecture approach or
a computer approach for teaching statistics. Use hypothesis testing to test the independence of opinion
between the two groups.
Table 11-3 Prefer Lecture Prefer Computer No Preference Full-time 8 13 6 Adjunct 11 22 10
-What is the expected value of an adjunct professor who prefers to lecture?
(Multiple Choice)
4.7/5 (37)
A manager of a health club believes that 32% of the members joined his club in the winter, 24% joined in
the spring, 20% joined in the summer, and 24% joined in the fall. The number of memberships this year
shows that 110 joined in the winter, 70 joined in the spring, 60 in the summer, and 68 in the fall. The test value for this scenario would be 2.05.
(True/False)
4.8/5 (33)
A four-year university has decided to implement a new approach to teaching statistics. Full-time and
adjunct professors were surveyed to determine whether they preferred the traditional lecture approach or
a computer approach for teaching statistics. Use hypothesis testing to test the independence of opinion
between the two groups.
Table 11-3 Prefer Lecture Prefer Computer No Preference Full-time 8 13 6 Adjunct 11 22 10
-What is the expected value of a full-time professor who has no preference?
(Multiple Choice)
4.8/5 (39)
Filters
- Essay(0)
- Multiple Choice(0)
- Short Answer(0)
- True False(0)
- Matching(0)