Exam 3: Data Description
Exam 1: The Nature of Probability and Statistics54 Questions
Exam 2: Frequency Distributions and Graphs83 Questions
Exam 3: Data Description101 Questions
Exam 4: Discrete Probability Distributions79 Questions
Exam 5: The Normal Distribution84 Questions
Exam 6: Confidence Intervals and Sample Size76 Questions
Exam 7: Hypothesis Testing90 Questions
Exam 8: Testing the Difference Between Two Means, Two Proportions, and Two Variances74 Questions
Exam 9: Correlation and Regression83 Questions
Exam 10: Chi-Square and Analysis of Variance Anova71 Questions
Exam 11: Tables71 Questions
Exam 12: Data Bank91 Questions
Exam 13: Glossary68 Questions
Select questions type
If the boxplot for one set of data is much wider than the boxplot for a second set of data, then
(Multiple Choice)
4.8/5  (40)
(40)
A student received the following grades: An A in Statistics (4 credits), a C in Physics II (5 credits), a B in Sociology (3 credits), a B in a Literature seminar (2 credits), and a D in Tennis (1 credit). Assuming
A = 4 grade points, B = 3 grade points, C = 2 grade points, D = 1 grade point, and F = 0 grade points, the
Student's grade point average is:
(Multiple Choice)
4.7/5 (39)
Which of the following data sets (each consists of 1000 values grouped into a histogram) have the smallest value of
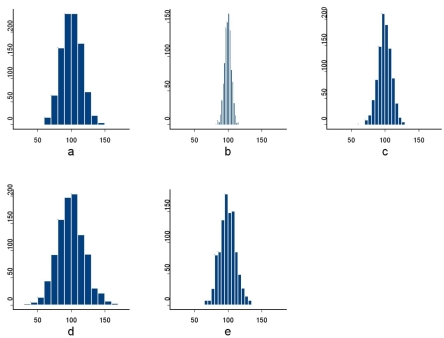
(Multiple Choice)
4.9/5 (45)
What is the correct standard score for a batter who normally averages 0.325, with a standard deviation of 0.065 if he scores 0.410 for one game?
(Multiple Choice)
4.8/5 (42)
Find the weighted mean for three exams if the first one was worth 75 points and the student received a
score of , the second was worth 50 points and the student received a score of and the third was
worth 30 points and the student received a score of ?
(Short Answer)
4.7/5 (34)
The median can be a more appropriate measure of central tendency if the distribution of the data is
extremely skewed.
(True/False)
4.8/5 (35)
What is the mode of the following numbers? -10, 4, 2, -2, 2, 0, -3
(Multiple Choice)
4.8/5 (34)
Using the following frequency distribution, find the variance.
Temperature Frequency 28.5-31.5 1 31.5-34.5 3 34.5-37.5 6 37.5-40.5 10 40.5-43.5 8 43.5-46.5 7
(Multiple Choice)
4.8/5 (44)
The variance is the square root of the standard deviation of a set of data.
(True/False)
4.9/5 (38)
If the value 5 has z-score of -0.75 in a dataset, then the mean of that dataset is
(Multiple Choice)
4.8/5 (40)
percentile.
Class Boundaries Frequencies 13.5-18.5 4 18.5-23.5 9 23.5-28.5 12 28.5-33.5 15 33.5-38.5 18
(Multiple Choice)
4.9/5 (45)
All the values in a dataset are between 9 and 12, except for one value of 92. That value 92 is likely to be
(Multiple Choice)
4.9/5 (39)
Given the following data set, find the IQR.
29, 52, 42, 36, 57, 78, 43, 92
(Short Answer)
5.0/5 (33)
_______________ applies to any distribution regardless of its shape.
________________________________________
(Short Answer)
4.8/5 (46)
For a set of data with mean 12 and variance 36, approximately 68% of the values will fall between 0 and
(True/False)
4.7/5 (30)
Filters
- Essay(0)
- Multiple Choice(0)
- Short Answer(0)
- True False(0)
- Matching(0)