Exam 17: Time-Series Analysis and Forecasting
Exam 1: What Is Statistics17 Questions
Exam 2: Types of Data, Data Collection and Sampling18 Questions
Exam 3: Graphical Descriptive Techniques Nominal Data17 Questions
Exam 4: Graphical Descriptive Techniques Numerical Data65 Questions
Exam 5: Numerical Descriptive Measures149 Questions
Exam 6: Probability113 Questions
Exam 7: Random Variables and Discrete Probability Distributions50 Questions
Exam 8: Continuous Probability Distributions113 Questions
Exam 9: Statistical Inference and Sampling Distributions69 Questions
Exam 10: Estimation: Describing a Single Population125 Questions
Exam 11: Estimation: Comparing Two Populations36 Questions
Exam 12: Hypothesis Testing: Describing a Single Population124 Questions
Exam 13: Hypothesis Testing: Comparing Two Populations69 Questions
Exam 14: Additional Tests for Nominal Data: Chi-Squared Tests113 Questions
Exam 15: Simple Linear Regression and Correlation213 Questions
Exam 16: Multiple Regression122 Questions
Exam 17: Time-Series Analysis and Forecasting147 Questions
Exam 18: Index Numbers27 Questions
Select questions type
The following linear trend was estimated using a time series regression with the origin in the year 2000. ŷ = 76.80 + 3.14t.
Which of the following is the forecast for the year 2013?
(Multiple Choice)
4.8/5  (33)
(33)
A time series regression model using quarterly time periods will only use three quarters as the indicator variables.
(True/False)
4.8/5 (33)
The time-series component that reflects a long-term, relatively smooth pattern or direction exhibited by a time series over a long time period is called trend.
(True/False)
4.8/5 (33)
A company selling swimming goggles wants to analyze the company's Australian sales figure.
Describe the 4 components of the line graph of Swimming goggle quarterly sales (in $000's) given below. 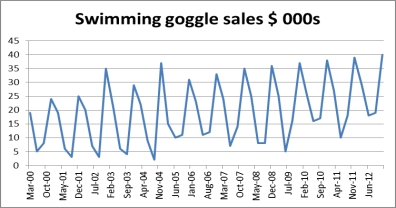
(Essay)
4.8/5 (41)
In an exponentially smoothed time series, the smoothing constant w is chosen on the basis of how much smoothing is required. In general, a small value of w such as 0.1 results in a great deal of smoothing, while a large value of w, such as 0.9, results in very little smoothing.
(True/False)
4.9/5 (34)
The effect that business recessions and prosperity have on time-series values is an example of the disaster component of a time series.
(True/False)
4.8/5 (32)
One application of seasonal indexes is to remove the seasonal variation in a time series. The process is called deseasonalising, and the result is called a seasonally adjusted time series.
(True/False)
4.9/5 (31)
Given the following time series, compute the seasonal (quarterly) indexes, using the four-quarter centred moving averages. Quarter 2011 2012 2013 2014 2015 1 62 48 50 43 57 2 51 45 46 39 32 3 53 44 46 37 31 4 46 37 42 32 29
(Essay)
4.8/5 (37)
Which of the following models might be appropriate to describe a new product that has experienced a rapid early growth rate followed by the inevitable levelling-off?
(Multiple Choice)
4.8/5 (43)
If data for a time-series analysis are collected on a monthly basis only, which component of the time series may be ignored?
(Multiple Choice)
4.7/5 (36)
For which of the following values of the smoothing constant w will the smoothed series catch up most quickly whenever the original time series changes direction?
(Multiple Choice)
4.7/5 (28)
a. Apply exponential smoothing with w = 0.1 and w = 0.8 to help detect the components of the following time series. Period t yt 1 40 2 45 3 44 4 47 5 48 6 50 7 52 8 51 9 48 10 47 b. Draw the time series and the two sets of exponentially smoothed values. Does there appear to be a trend component in the time series?
(Essay)
4.9/5 (29)
The following seasonal indexes and trend line were computed from five years of quarterly sales data.
Trend line: ŷt = 325 + 18.5t, t = 1, 2, 3, …20. Quarter Seasonal index 1 1.35 2 1.22 3 0.88 4 0.55 Forecast the sales for the next four quarters.
(Essay)
4.8/5 (35)
Of the four components of the multiplicative time-series model, the ratio of the time series to the moving average isolates the:
(Multiple Choice)
4.7/5 (40)
In measuring the cyclical effect of a time series, cycles need to be isolated. The measure we use to identify cyclical variation is the:
(Multiple Choice)
4.8/5 (37)
Use exponential smoothing, with w = 0.23 to forecast the next value of the time series below. t 1 20 2 16 3 24 4 25 5 22 6 21
(Essay)
4.7/5 (34)
Smoothing time-series data by the moving average method or exponential smoothing method is an attempt to remove the effect of the:
(Multiple Choice)
4.8/5 (34)
The most commonly used measures of forecast accuracy are the mean absolute deviation (MAD) and the sum of squares for forecast error (SSE).
(True/False)
4.7/5 (43)
The trend line ŷt = 125 + 2t and seasonal indexes shown below were computed from 10 years of quarterly data. Forecast the values for the next four quarters. Quarter S 1 0.6 2 1.3 3 1.6 4 0.5
(Essay)
4.8/5 (31)
Filters
- Essay(0)
- Multiple Choice(0)
- Short Answer(0)
- True False(0)
- Matching(0)