Exam 5: Numerical Descriptive Measures
Exam 1: What Is Statistics17 Questions
Exam 2: Types of Data, Data Collection and Sampling18 Questions
Exam 3: Graphical Descriptive Techniques Nominal Data17 Questions
Exam 4: Graphical Descriptive Techniques Numerical Data65 Questions
Exam 5: Numerical Descriptive Measures149 Questions
Exam 6: Probability113 Questions
Exam 7: Random Variables and Discrete Probability Distributions50 Questions
Exam 8: Continuous Probability Distributions113 Questions
Exam 9: Statistical Inference and Sampling Distributions69 Questions
Exam 10: Estimation: Describing a Single Population125 Questions
Exam 11: Estimation: Comparing Two Populations36 Questions
Exam 12: Hypothesis Testing: Describing a Single Population124 Questions
Exam 13: Hypothesis Testing: Comparing Two Populations69 Questions
Exam 14: Additional Tests for Nominal Data: Chi-Squared Tests113 Questions
Exam 15: Simple Linear Regression and Correlation213 Questions
Exam 16: Multiple Regression122 Questions
Exam 17: Time-Series Analysis and Forecasting147 Questions
Exam 18: Index Numbers27 Questions
Select questions type
Which of the following summary measures cannot be easily approximated from a box-and-whisker plot?
Free
(Multiple Choice)
4.9/5  (31)
(31)
Correct Answer: Verified
D
Is the following histogram constructed from the weight data unimodal, bimodal or multimodal? 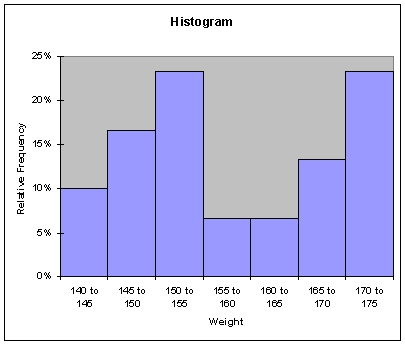
Free
(Short Answer)
4.9/5 (36)
Correct Answer:Verified
Bimodal.
A sample of 25 families was asked how many pets they owned. Their responses are summarized in the following table. Number of pets 0 1 2 3 4 5 Number of families 3 10 5 4 2 1 a. Determine the mean, the median and the mode of the number of pets owned per family.
b. Describe briefly what each statistic in part (a) tells you about the data.
Free
(Essay)
4.8/5 (38)
Correct Answer:Verified
a. x = 1.80 pet, median = 1 pet, mode = 1 pet.
b. The 'average' number of pets owned was 1.80 pets. Half the families own at most one pet, and the other half own at least one pet. The most frequent number of pets owned was one pet.
The following data represent the numbers of bedrooms in a sample of 10 suburban houses in Mel-bourne:
3 3 2 2 4 5 2 5 4 2
Use these data to answer the following question/s.
-a. Compute the range.
b. Compute the variance.
c. Compute the standard deviation.
(Short Answer)
4.9/5 (31)
The relative frequency histogram for the age (in years) of a sample of 25 employees from a
government department, is given below. 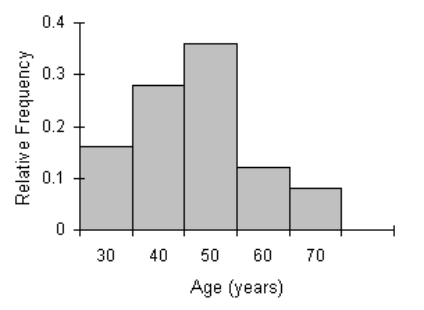 Explain what the best measure of central location is.
(Essay)
4.9/5 (41)
Data were obtained for the weight in grams, of a sample of 10 packets of sweetener, as found in cafés. 4.5 5 5.9 5.4 5.5 4.7 4.9 4.7 4.7 4.6 Find the mean, median and mode weight packet of sweetener and explain which is the best measure of central location.
(Essay)
4.8/5 (29)
The number of hours a college student spent studying during the final exam week was recorded as follows: 7
6
4
9
8
\begin{tabular} { l | l } 5 & 10 \\ \hline \end{tabular} Compute the range, x, s2 and s for these data. Express each number in appropriate units.
(Essay)
4.8/5 (36)
The following data represent the ages (in years) of a sample of 25 employees from a government
department: 31 43 56 23 49 42 33 61 44 28 48 38 44 35 40 64 52 42 47 39 53 27 36 35 20 Find the lower quartile of the ages.
(Essay)
4.9/5 (46)
A sample of 12 measurements has a mean of 25 and a standard deviation of 4. Suppose that the sample is enlarged to 14 measurements, by including two additional measurements having a common value of 25.
a. Find the mean of the sample of 14 measurements.
b. Find the standard deviation of the sample of 14 measurements.
(Essay)
4.7/5 (28)
What are the relative magnitudes of the mean, median and mode for a unimodal distribution that is:
a. symmetrical?
b. skewed to the left?
c. skewed to the right?
(Essay)
4.8/5 (33)
Data were obtained for the weight in grams, of a sample of 10 packets of sweetener, as found in cafés. 4.5 5 5.9 5.4 5.5 4.7 4.9 4.7 4.7 4.6 Find the variance.
(Short Answer)
4.8/5 (26)
The following data represent the salaries (in thousands of dollars) of a sample of 13 employees of a firm: 26.5 23.5 29.7 24.8 21.1 24.3 20.4 22.7 27.2 23.7 24.1 24.8 28.2 Compute the range.
(Short Answer)
4.9/5 (26)
The coefficient of determination measures the percentage of variation in the independent variable explained by the dependent variable.
(True/False)
4.7/5 (26)
According to Chebyshev's theorem, which of the following is the percentage of measurements in a data set that fall within three standard deviations of their mean?
(Multiple Choice)
4.7/5 (34)
The following data represent the weights (in kilograms) of a sample of 30 horses: Weight
165 175 150 155 173 149 145 153 153 153 152 145 164 143 170 175 148 174 171 156 166 168 152 150 173 168 146 155 172 159 Are there any outliers?
(Essay)
4.7/5 (29)
The mode is the only measure of central location for a distribution of a nominal (categorical) variable.
(True/False)
4.9/5 (37)
The following data represent the weights (in kilograms) of a sample of 30 horses: Weight
165 175 150 155 173 149 145 153 153 153 152 145 164 143 170 175 148 174 171 156 166 168 152 150 173 168 146 155 172 159 Determine the location and value of the upper quartile of the weights.
(Essay)
4.9/5 (45)
The following data represent the ages (in years) of a sample of 25 employees from a government
department: 31 43 56 23 49 42 33 61 44 28 48 38 44 35 40 64 52 42 47 39 53 27 36 35 20 Find the upper quartile of the ages.
(Essay)
4.9/5 (45)
Which of the following is the proportion of the total area that must be to the left of the median, in a histogram?
(Multiple Choice)
4.7/5 (39)
The following data represent the salaries (in thousands of dollars) of a sample of 13 employees of a firm: 26.5 23.5 29.7 24.8 21.1 24.3 20.4 22.7 27.2 23.7 24.1 24.8 28.2 Compute the median salary.
(Short Answer)
4.8/5 (32)
Filters
- Essay(0)
- Multiple Choice(0)
- Short Answer(0)
- True False(0)
- Matching(0)