Exam 7: Statistics and Probability
Exam 1: The Whole Numbers360 Questions
Exam 2: Multiplying and Dividing Fractions234 Questions
Exam 3: Adding and Subtracting Fractions157 Questions
Exam 4: Decimals271 Questions
Exam 5: Ratio, Proportion, and Percent297 Questions
Exam 6: Geometry280 Questions
Exam 7: Statistics and Probability133 Questions
Exam 8: Real Numbers and Introduction to Algebra483 Questions
Exam 9: Equations, Inequalities, and Problem Solving224 Questions
Exam 10: Graphing Equations and Inequalities312 Questions
Exam 11: Systems of Equations111 Questions
Exam 12: Exponents and Polynomials386 Questions
Exam 13: Factoring Polynomials233 Questions
Exam 14: Rational Expressions249 Questions
Exam 15: Roots and Radicals220 Questions
Exam 16: Quadratic Equations and Nonlinear Graphs198 Questions
Exam 17: Algebraic Equations and Inequalities199 Questions
Select questions type
Find the mean, median, and mode of the list of numbers. If necessary, round to the nearest tenth.
-100, 67, 84, 67, 81
(Multiple Choice)
4.7/5  (36)
(36)
Find the grade point average. If necessary, round to the nearest hundredth.
- Grade Credit Hours A 2 C 1 D 1 F 2 C 2
(Multiple Choice)
4.8/5 (30)
Fill in the blank with one of the words or phrases listed below. outcomes bar experiment mean tree diagram pictograph line class interval median probability histogram circle class frequency mode
-A(n)_______is one way to picture and count outcomes.
(Multiple Choice)
4.9/5 (35)
Fill in the blank with one of the words or phrases listed below. outcomes bar experiment mean tree diagram pictograph line class interval median probability histogram circle class frequency mode
-A(n)_______graph presents data using vertical or horizontal bars.
(Multiple Choice)
4.9/5 (33)
Draw a tree diagram to find the number of possible outcomes.
-Choose a number, 1, 2, 3, 4, and then a vowel, a,e,i,o,u.
(Multiple Choice)
4.8/5 (42)
Fill in the blank with one of the words or phrases listed below. outcomes bar experiment mean tree diagram pictograph line class interval median probability histogram circle class frequency mode
-The_______ of a set of numbers is the number that occurs the most often.
(Multiple Choice)
4.8/5 (33)
The circle graph shows the results of the student council presidential election. The complete circular area represents 100%
of the votes.
-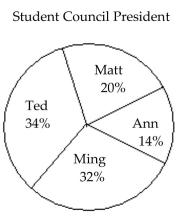 300 total votes The circle graph shows what percent of the vote each person received.How many votes did Ted get?
(Multiple Choice)
4.9/5 (40)
Find the mean. If necessary, round to one decimal place.
-154, 117, 245, 150
(Multiple Choice)
4.7/5 (35)
Find the probability of the event if a single choice is made from a bag.
-A bag contains 6 red marbles, 6 blue marbles, 6 yellow marbles, and 7 green marbles. What is the probability of choosing a red marble when one marble is drawn?
(Multiple Choice)
4.8/5 (34)
The bar graph shows the number of tickets sold each week by the garden club for their annual flower show. 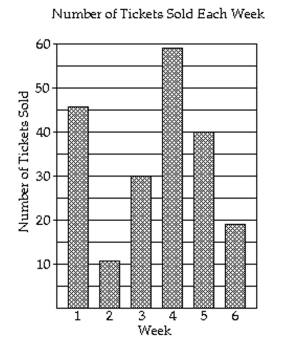 -During which week were 19 tickets sold?
(Multiple Choice)
4.7/5 (27)
The circle graph shows the results of the student council presidential election. The complete circular area represents 100%
of the votes.
-Student Council President 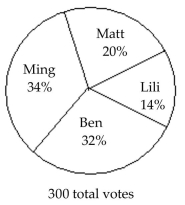 The circle graph shows what percent of the vote each person received. Find the ratio of Ming's votes to total votes cast.
(Multiple Choice)
4.9/5 (38)
The pictograph shows the number of bicycles sold at Mountain Biking Mania for a 7-week period. Number of Bicycles Sold at Mountain Biking Mania
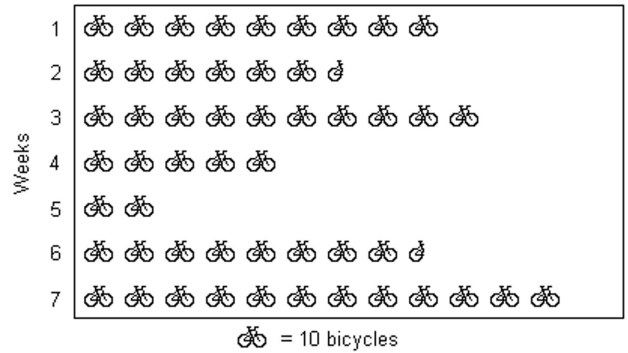 -What was the total number of bicycles sold in this 7-week period?
(Multiple Choice)
4.9/5 (41)
Find the probability of the event.
-If a single die is tossed once, find the probability of the following event. An even number.
(Multiple Choice)
4.8/5 (37)
The bar graph shows the number of tickets sold each week by the garden club for their annual flower show.
-How many tickets were sold in all?
(Multiple Choice)
4.8/5 (43)
Find the probability of the event.
-If a single die is tossed once, find the probability of the following event. A 1 or a 4 or a 3
(Multiple Choice)
4.9/5 (34)
Solve.
-A new drug is being tested that is supposed to lower cholesterol. This drug was given to 300 people and the results are below. Lower Higher Cholesterol Cholesterol Cholesterol not Changed 114 40 146 If a person is testing this drug, what is the probability that their cholesterol will be higher?
(Multiple Choice)
4.9/5 (43)
The histogram shows the scores of each participant in a game from a total of 100 participants. 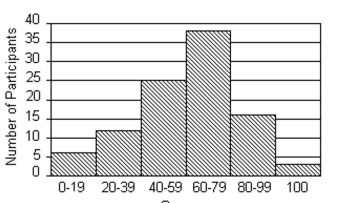 -What is the ratio of participants who score 20-39 to the total number of participants?
(Multiple Choice)
5.0/5 (32)
Draw a tree diagram to find the number of possible outcomes.
-Toss a single die, and then toss a coin.
(Multiple Choice)
4.7/5 (39)
Twenty teenagers were asked to give their current savings account balances. Use the balances shown in the list to
complete the frequency distribution table and construct a histogram.
- 499 1400 678 3123 3009 2299 692 2890 2159 1004 1234 900 2148 2377 2780 2550 1850 1049 1750 2289 Class Intervals (Account Balances Tally Class Frequency (Number of Teenagers) \ 0-\ 499 \ 500-\ 999 \ 1000-\ 1499 \ 1500-\ 1999 \ 2000-\ 2499 \ 2500-\ 2999 \ 3000-\ 3499
(Essay)
4.7/5 (27)
The histogram shows the scores of each participant in a game from a total of 100 participants.
-How many participants scored 40-59?
(Multiple Choice)
4.8/5 (34)
Filters
- Essay(0)
- Multiple Choice(0)
- Short Answer(0)
- True False(0)
- Matching(0)