Exam 7: Statistics and Probability
Exam 1: The Whole Numbers360 Questions
Exam 2: Multiplying and Dividing Fractions234 Questions
Exam 3: Adding and Subtracting Fractions157 Questions
Exam 4: Decimals271 Questions
Exam 5: Ratio, Proportion, and Percent297 Questions
Exam 6: Geometry280 Questions
Exam 7: Statistics and Probability133 Questions
Exam 8: Real Numbers and Introduction to Algebra483 Questions
Exam 9: Equations, Inequalities, and Problem Solving224 Questions
Exam 10: Graphing Equations and Inequalities312 Questions
Exam 11: Systems of Equations111 Questions
Exam 12: Exponents and Polynomials386 Questions
Exam 13: Factoring Polynomials233 Questions
Exam 14: Rational Expressions249 Questions
Exam 15: Roots and Radicals220 Questions
Exam 16: Quadratic Equations and Nonlinear Graphs198 Questions
Exam 17: Algebraic Equations and Inequalities199 Questions
Select questions type
The bar graph shows the expenditures of one city government in a recent year. 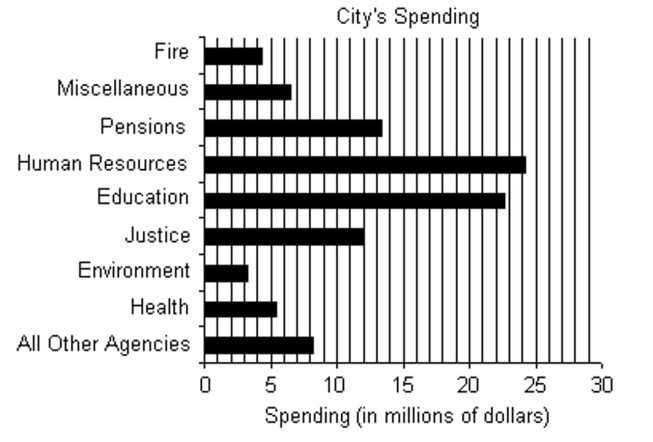 -How much more is spent on Health than on Fire?
(Multiple Choice)
4.9/5  (46)
(46)
Find the median. If necessary, round to one decimal place.
-1.5, 0.5, 0.7, 1.5, 0.3, 1.7, 0.3, 1.8, 2.2
(Multiple Choice)
4.8/5 (31)
Find the median. If necessary, round to one decimal place.
-14, 14, 31, 50, 66, 75, 77
(Multiple Choice)
4.8/5 (41)
Find the probability of the event if a single choice is made from a bag.
-A bag contains 8 red marbles, 4 blue marbles, and 9 green marbles. What is the probability of choosing a blue marble when one marble is drawn?
(Multiple Choice)
4.9/5 (40)
The line graph shows the recorded hourly temperatures in degrees Fahrenheit at an airport. 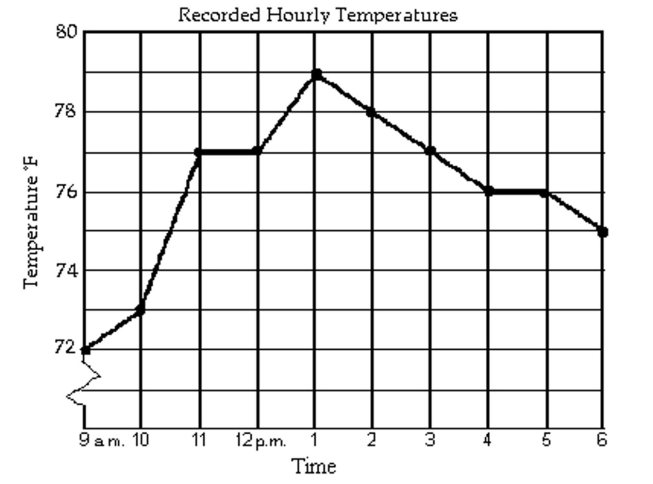 -At what time was the temperature 73°?
(Multiple Choice)
4.9/5 (31)
Draw a tree diagram to find the number of possible outcomes.
-Pick a number from 1, 2, 3 or 4, and then toss a coin.
(Multiple Choice)
4.9/5 (41)
Draw a tree diagram for the experiment to find the number of outcomes.
-Tossing a coin twice
(Multiple Choice)
4.7/5 (40)
Use the information given to draw a vertical bar graph. Clearly label the bars on the graph shown below.
-Entree Choices of Customers During One Week Entree Number of Customers Grilled Salmon 35 Chicken Salad 40 Beef Stew 30 Ham Pie 45 Bacon Burger 38 Cheese Pizza 22 
(Essay)
4.8/5 (34)
The bar graph shows the number of tickets sold each week by the garden club for their annual flower show. 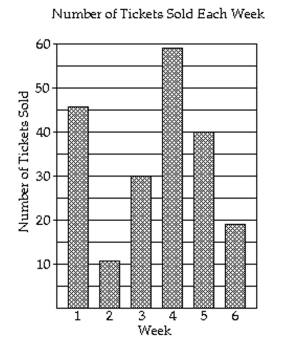 -During which week was the fewest number of tickets sold?
(Multiple Choice)
4.9/5 (33)
The double-line graph shows temperature highs and lows for a week. 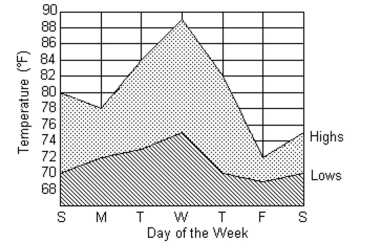 -What was the high temperature reading on Wednesday?
(Short Answer)
4.8/5 (32)
Draw a tree diagram to find the number of possible outcomes.
-Toss two six-sided dice.
(Multiple Choice)
4.8/5 (48)
The following pictograph shows the number of bicyclists who participated in the Labor Day weekend bicycle race for the
years 2003-2009. Use the graph to answer the question. 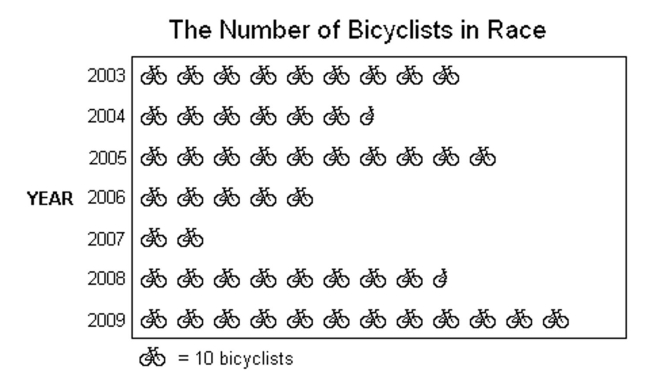 -How many cyclists participated in 2003?
(Multiple Choice)
4.9/5 (40)
The following pictograph shows the number of bicyclists who participated in the Labor Day weekend bicycle race for the
years 2003-2009. Use the graph to answer the question.
-In what year did 85 cyclists participate?
(Multiple Choice)
4.8/5 (37)
The following pictograph shows the number of bicyclists who participated in the Labor Day weekend bicycle race for the
years 2003-2009. Use the graph to answer the question.
-What was the greatest number of cyclists to participate in any one year?
(Multiple Choice)
4.9/5 (35)
The following circle graph displays Chris and Mary Smith's monthly $2900 family budget. Use the circle graph to answer
the question. 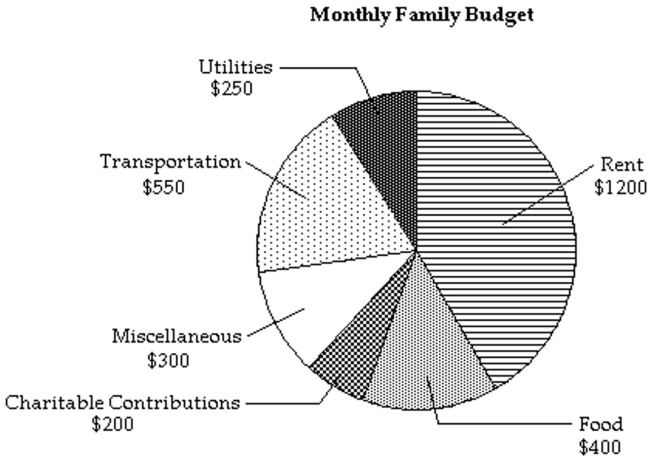 -What is the ratio of money spent on miscellaneous to the total amount of the monthly budget?
(Multiple Choice)
4.7/5 (37)
Fill in the blank with one of the words or phrases listed below. outcomes bar experiment mean tree diagram pictograph line class interval median probability histogram circle class frequency mode
-A(n)_______is a graph in which pictures or symbols are used to visually present data.
(Multiple Choice)
5.0/5 (51)
The list shows the scores for a basketball team. Use the list to complete the frequency distribution table and construct a histogram.
- 40 31 35 28 19 17 26 33 31 30 28 29 29 26 27 Class Intervals (Scores) Tally Class Frequency (Number of Games) 10-19 20-29 30-39 40-49
(Essay)
4.8/5 (43)
Find the mean. If necessary, round to one decimal place.
-5, 15, 13, 6, 15, 3, 9, 6
(Multiple Choice)
4.7/5 (30)
Fill in the blank with one of the words or phrases listed below. outcomes bar experiment mean tree diagram pictograph line class interval median probability histogram circle class frequency mode
-The possible results of an experiment are the_______ .
(Multiple Choice)
4.9/5 (45)
Find the mode or modes (if any).
-7.05, 7.41, 7.56, 7.05, 7.88, 7.99, 7.62
(Multiple Choice)
4.8/5 (44)
Filters
- Essay(0)
- Multiple Choice(0)
- Short Answer(0)
- True False(0)
- Matching(0)