Exam 3: Graphs and Functions
Exam 1: Basic Concepts306 Questions
Exam 2: Equations and Inequalities234 Questions
Exam 3: Graphs and Functions61 Questions
Exam 4: Systems of Equations and Inequalities116 Questions
Exam 5: Polynomials and Polynomial Functions112 Questions
Exam 6: Rational Expressions and Equations130 Questions
Exam 7: Roots, Radicals, and Complex Numbers298 Questions
Exam 8: Quadratic Functions221 Questions
Exam 9: Exponential and Logarithmic Functions229 Questions
Exam 10: Characteristics of Functions and Their Graphs142 Questions
Exam 11: Conic Sections132 Questions
Exam 12: Sequences, Series, and Probability208 Questions
Select questions type
Determine the quadrant in which the point is located.
-(2, 1)
(Multiple Choice)
4.9/5  (38)
(38)
Write the word or phrase that best completes each statement or answers the question.
Solve the problem.
-The population of an endangered species of fish were moved to a controlled habitat to encourage the species to
increase in numbers. When they were moved there were 47 members in the population. In 18 months there
were 209 members in the population, with a growth pattern that was approximately linear. Draw a graph that
fits this data. On the graph, darken the part of the graph where the population is less than or equal to 100
members. Estimate, to the nearest month, how many months passed before the population reached 100. 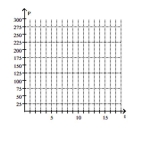
(Essay)
4.8/5 (40)
Determine the quadrant in which the point is located.
-(-4, 5)
(Multiple Choice)
4.8/5 (34)
Determine whether the graph illustrated represents a function. Give the domain and range of the relation or function.
-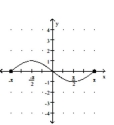
(Multiple Choice)
4.8/5 (35)
Determine if the relation illustrated is a function. Give the domain and range of the function or relation.
-five times a number 3\rightarrow15 4\rightarrow20 5\rightarrow25 6\rightarrow30
(Multiple Choice)
4.8/5 (37)
Determine if the relation illustrated is a function. Give the domain and range of the function or relation.
-{(-2, 7), (-1, 4), (0, 3), (1, 4), (3, 12)}
(Multiple Choice)
4.7/5 (37)
Determine whether the graph illustrated represents a function. Give the domain and range of the relation or function.
-
(Multiple Choice)
4.8/5 (39)
List the ordered pair corresponding to the indicated point. 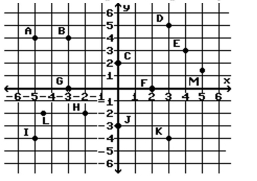 -M
-M
(Multiple Choice)
4.8/5 (33)
List the ordered pair corresponding to the indicated point.
-B
(Multiple Choice)
4.8/5 (37)
The graph below shows the percentage of students enrolled in the College of Engineering at State University. Use the
graph to answer the question. 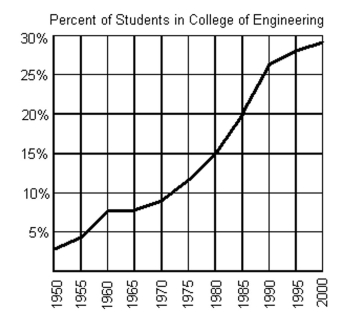 -In what year were 28% of the students at State University enrolled in the College of Engineering?
(Multiple Choice)
4.9/5 (38)
List the ordered pair corresponding to the indicated point.
-E
(Multiple Choice)
4.7/5 (39)
Determine whether the given ordered pair is a solution to the given equation.
-
(Multiple Choice)
4.8/5 (29)
Write the word or phrase that best completes each statement or answers the question.
Use a calculator to obtain at least eight points that are solutions to the equation. Then graph the equation by plotting
points.
-
(Essay)
4.8/5 (33)
Solve the problem.
-Mark started out by walking up a hill for 5 minutes. For the next 5 minutes he walked down a steep hill to an elevation lower than his starting point. For the next 10 minutes he walked on level ground. For the next 10
Minutes he walked uphill. Determine which graph of elevation above sea level versus time matches the given
Situation.
(Multiple Choice)
4.8/5 (28)
List the ordered pair corresponding to the indicated point.
-D
(Multiple Choice)
4.9/5 (41)
Determine whether the given ordered pair is a solution to the given equation.
-
(Multiple Choice)
4.8/5 (35)
Determine whether the given ordered pair is a solution to the given equation.
-
(Multiple Choice)
4.8/5 (42)
Write the word or phrase that best completes each statement or answers the question.
Use a calculator to obtain at least eight points that are solutions to the equation. Then graph the equation by plotting
points.
-
(Essay)
4.9/5 (36)
Filters
- Essay(0)
- Multiple Choice(0)
- Short Answer(0)
- True False(0)
- Matching(0)