Exam 1: Functions and Graphs
Exam 1: Functions and Graphs224 Questions
Exam 2: Limits and the Derivative123 Questions
Exam 3: Additional Derivative Topics126 Questions
Exam 4: Graphing and Optimization116 Questions
Exam 5: Integration93 Questions
Exam 6: Additional Integration Topics82 Questions
Exam 7: Multivariable Calculus78 Questions
Exam 8: Trigonometric Functions92 Questions
Exam 9: Differential Equations47 Questions
Exam 10: Taylor Polynomials and Infinite Series48 Questions
Exam 11: Probability and Calculus57 Questions
Exam 12: Basic Algebra Review44 Questions
Exam 13: Special Topics20 Questions
Select questions type
Provide an appropriate response.
-Write the equation of the line in the following graph. 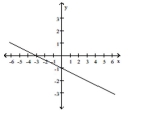
(Multiple Choice)
4.8/5  (36)
(36)
Solve the problem.
-The financial department of a company that manufactures portable MP3 players arrived at the following daily
cost equation for manufacturing x MP3 players per day: 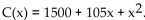 The average cost per unit at a
production level of players per day is
The average cost per unit at a
production level of players per day is  (A) Find the rational function
  (B) Graph the average cost function on a graphing utility for
  (C) Use the appropriate command on a graphing utility to find the daily production level (to the nearest integer) at
which the average cost per player is a minimum. What is the minimum average cost (to the nearest cent)?
(C) Use the appropriate command on a graphing utility to find the daily production level (to the nearest integer) at
which the average cost per player is a minimum. What is the minimum average cost (to the nearest cent)?
(Essay)
4.8/5 (37)
Solve the problem.
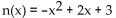
-The polynomial 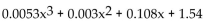 gives the approximate total earnings of a company, in millions of dollars, where x represents the number of years since 1996. This model is valid for the years from
1996 to 2000. Determine the earnings for 2000. Round to 2 decimal places.
gives the approximate total earnings of a company, in millions of dollars, where x represents the number of years since 1996. This model is valid for the years from
1996 to 2000. Determine the earnings for 2000. Round to 2 decimal places.
(Multiple Choice)
4.8/5 (42)
Use a calculator to evaluate the expression. Round the result to five decimal places.
-log 51.237
(Multiple Choice)
4.8/5 (40)
Use a calculator to evaluate the expression. Round the result to five decimal places.
-log8 36.8
(Multiple Choice)
4.8/5 (42)
Use the REGRESSION feature on a graphing calculator.
-The paired data below consists of the temperature on randomly chosen days and the amount of a certain kind of plant grew (in millimeters). 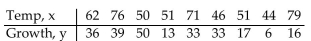 Find the linear function that predicts a plant's growth as a function of the temperature. Round your answer to two
Decimal places.
Find the linear function that predicts a plant's growth as a function of the temperature. Round your answer to two
Decimal places.
(Multiple Choice)
4.9/5 (37)
Solve the problem.
-The cost of manufacturing a computer part is related to the quantity produced, x, during a production run. When 100 parts are produced, the cost is $300. When 600 parts are produced, the cost is $4800. Find an equation
Of the line relating quantity produced to cost. Write the final answer in the form C = mx + b.
(Multiple Choice)
4.8/5 (45)
Use the REGRESSION feature on a graphing calculator.
-Since 1984 funeral directors have been regulated by the Federal Trade Commission. The average cost of a funeral for an adult in a Midwest city has increased, as shown in the following table. 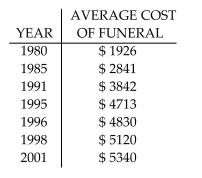 Let x represent the number of years since 1980. Use a graphing calculator to fit a quartic function to the data. Round
Your answer to five decimal places.
Let x represent the number of years since 1980. Use a graphing calculator to fit a quartic function to the data. Round
Your answer to five decimal places.
(Multiple Choice)
4.8/5 (38)
Use point-by-point plotting to sketch the graph of the equation.
-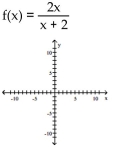
(Multiple Choice)
4.8/5 (30)
Solve the problem.
-The function M described by M(x) = 2.89x + 70.64 can be used to estimate the height, in centimeters, of a male whose humerus (the bone from the elbow to the shoulder) is x cm long. Estimate the height of a male whose
Humerus is 30.93 cm long. Round your answer to the nearest four decimal places.
(Multiple Choice)
4.8/5 (37)
Write an equation for the lowest-degree polynomial function with the graph and intercepts shown in the figure.
-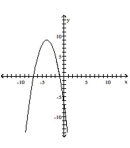
(Multiple Choice)
4.8/5 (39)
Find the slope and y intercept of the graph of the equation.
-y = x - 2
(Multiple Choice)
4.8/5 (29)
Solve the problem.
-The U. S. Census Bureau compiles data on population. The population (in thousands) of a southern city can be approximated by 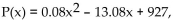 where x corresponds to the years after 1950. In what calendar
Year was the population about 804,200?
where x corresponds to the years after 1950. In what calendar
Year was the population about 804,200?
(Multiple Choice)
4.8/5 (42)
Provide an appropriate response.
-Assume it costs 25 cents to mail a letter weighing one ounce or less, and then 20 cents for each additional ounce or fraction of an ounce. Let L(x) be the cost of mailing a letter weighing x ounces. Graph y = L(x). Use the
Interval (0, 4].
(Multiple Choice)
4.8/5 (40)
Find the vertex form for the quadratic function. Then find each of the following:
(A) Intercepts
(B) Vertex
(C) Maximum or minimum
(D) Range
-
(Multiple Choice)
4.8/5 (39)
Solve the problem.
-The number of reports of a certain virus has increased exponentially since 1960. The current number of cases can be approximated using the function 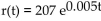 , where t is the number of years since 1960. Estimate
The of cases in the year 2010.
, where t is the number of years since 1960. Estimate
The of cases in the year 2010.
(Multiple Choice)
4.9/5 (25)
Filters
- Essay(0)
- Multiple Choice(0)
- Short Answer(0)
- True False(0)
- Matching(0)