Exam 1: Functions and Graphs
Exam 1: Functions and Graphs224 Questions
Exam 2: Limits and the Derivative123 Questions
Exam 3: Additional Derivative Topics126 Questions
Exam 4: Graphing and Optimization116 Questions
Exam 5: Integration93 Questions
Exam 6: Additional Integration Topics82 Questions
Exam 7: Multivariable Calculus78 Questions
Exam 8: Trigonometric Functions92 Questions
Exam 9: Differential Equations47 Questions
Exam 10: Taylor Polynomials and Infinite Series48 Questions
Exam 11: Probability and Calculus57 Questions
Exam 12: Basic Algebra Review44 Questions
Exam 13: Special Topics20 Questions
Select questions type
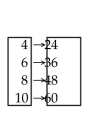
Determine whether the relation represents a function. If it is a function, state the domain and range.
-
(Multiple Choice)
4.7/5  (30)
(30)
Provide an appropriate response.
-The following table shows a recent state income tax schedule for married couples filing a joint return in State X. 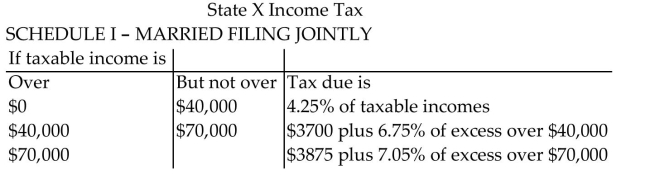 (i) Write a piecewise definition for the tax due T(x) on an income of x dollars. (ii) Graph T(x). (iii) Find the tax due on a taxable income of $50,000. Of $95,000.
(Multiple Choice)
4.7/5 (27)
Solve the problem.
-A sample of 800 grams of radioactive substance decays according to the function A 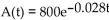 , where t is the time in years. How much of the substance will be left in the sample after 10 years? Round to the nearest
Whole gram.
, where t is the time in years. How much of the substance will be left in the sample after 10 years? Round to the nearest
Whole gram.
(Multiple Choice)
4.8/5 (35)
Solve the problem.
-In economics, functions that involve revenue, cost and profit are used. Suppose R(x) and C(x) denote the total revenue and the total cost, respectively, of producing a new high-tech widget. The difference P(x) = R(x) - C(x)
Represents the total profit for producing x widgets. Given 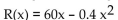 and C(x) = 3x + 13, find P(100).
(Multiple Choice)
4.8/5 (41)
For the given function, find each of the following:
(A) Intercepts
(B) Vertex
(C) Maximum or minimum
(D) Range
-g(x) = 
(Multiple Choice)
4.8/5 (32)
Solve the problem.
-Suppose the cost per ton, y, to build an oil platform of x thousand tons is approximated by 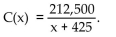 What is the cost per ton for x = 30?
(Multiple Choice)
4.9/5 (37)
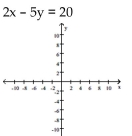
Graph the linear equation and determine its slope, if it exists.
-
(Multiple Choice)
4.8/5 (33)
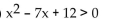
Use interval notation to write the solution set of the inequality.
-
(Multiple Choice)
5.0/5 (37)
Find the slope and y intercept of the graph of the equation.
-y = 52 x - 72
(Multiple Choice)
4.8/5 (36)
Use the REGRESSION feature on a graphing calculator.
-For some reason the quality of production decreased as the year progressed at a flash drive manufacturing plant. The following data represent the percentage of defective flash drives produced at the plant in the
Corresponding month of the year. 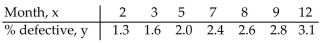 Use the regression equation with values rounded to four decimals to predict the percentage of defective drives in month
6, June.
Use the regression equation with values rounded to four decimals to predict the percentage of defective drives in month
6, June.
(Multiple Choice)
4.8/5 (35)
Provide an appropriate response.
-What is the minimum number of x intercepts that a polynomial of degree 11 can have? Explain.
(Multiple Choice)
4.9/5 (28)
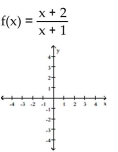
For the rational function below (i) Find the intercepts for the graph; (ii) Determine the domain; (iii) Find any vertical or
horizontal asymptotes for the graph; (iv) Sketch any asymptotes as dashed lines. Then sketch the graph of y = f(x).
-
(Multiple Choice)
4.9/5 (39)
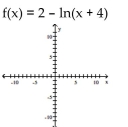
Graph the function using a calculator and point-by-point plotting. Indicate increasing and decreasing intervals.
-
(Multiple Choice)
4.9/5 (29)
Use the REGRESSION feature on a graphing calculator.
-As the number of farms has decreased in South Carolina, the average size of the remaining farms has grown larger, as shown below. 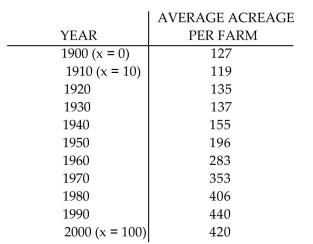 Let x represent the number of years since 1900. Use a graphing calculator to fit a quadratic function to the data. Round
Your answer to five decimal places.
Let x represent the number of years since 1900. Use a graphing calculator to fit a quadratic function to the data. Round
Your answer to five decimal places.
(Multiple Choice)
4.8/5 (36)
Filters
- Essay(0)
- Multiple Choice(0)
- Short Answer(0)
- True False(0)
- Matching(0)