Exam 1: Functions and Graphs
Exam 1: Functions and Graphs224 Questions
Exam 2: Limits and the Derivative123 Questions
Exam 3: Additional Derivative Topics126 Questions
Exam 4: Graphing and Optimization116 Questions
Exam 5: Integration93 Questions
Exam 6: Additional Integration Topics82 Questions
Exam 7: Multivariable Calculus78 Questions
Exam 8: Trigonometric Functions92 Questions
Exam 9: Differential Equations47 Questions
Exam 10: Taylor Polynomials and Infinite Series48 Questions
Exam 11: Probability and Calculus57 Questions
Exam 12: Basic Algebra Review44 Questions
Exam 13: Special Topics20 Questions
Select questions type
Use the REGRESSION feature on a graphing calculator.
-The use of bottled water in the United States has shown a steady increase in recent years. The table shows the annual per capita consumption for the years 1995 - 2001. 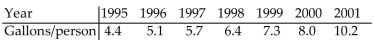 With x being the years since 1995, find the linear function that represents this data. Round your answer to two decimal
Places.
With x being the years since 1995, find the linear function that represents this data. Round your answer to two decimal
Places.
(Multiple Choice)
4.7/5  (35)
(35)
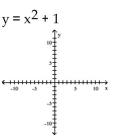
Use point-by-point plotting to sketch the graph of the equation.
-
(Multiple Choice)
4.8/5 (32)
Solve the problem.
-An initial investment of $12,000 is invested for 2 years in an account that earns 4% interest, compounded quarterly. Find the amount of money in the account at the end of the period.
(Multiple Choice)
4.9/5 (39)
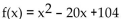
Determine whether there is a maximum or minimum value for the given function, and find that value.
-
(Multiple Choice)
4.8/5 (39)
Provide an appropriate response.
-Find the vertex and the maximum or minimum of the quadratic function 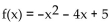 by first writing f in
standard form. State the range of f and find the intercepts of f .
by first writing f in
standard form. State the range of f and find the intercepts of f .
(Essay)
4.8/5 (33)
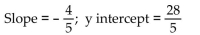
Write an equation of the line with the indicated slope and y intercept.
-
(Multiple Choice)
4.8/5 (34)
Determine whether the relation represents a function. If it is a function, state the domain and range.
-{(41, -3), (5, -2), (5, 0), (9, 2), (21, 4)}
(Multiple Choice)
4.7/5 (37)
Provide an appropriate response.
-The following graph represents the result of applying a sequence of transformations to the graph of a basic
function. Identify the basic function and describe the transformation(s). Write the equation for the given graph. 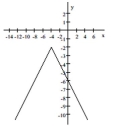
(Essay)
4.9/5 (40)
Solve the problem.
-Suppose that $2200 is invested at 3% interest, compounded semiannually. Find the function for the amount of money after t years.
(Multiple Choice)
4.9/5 (35)
Use a calculator to evaluate the expression. Round the result to five decimal places.
-ln 1097
(Multiple Choice)
4.7/5 (33)
Use the REGRESSION feature on a graphing calculator.
-A study was conducted to compare the average time spent in the lab each week versus course grade for computer students. The results are recorded in the table below. 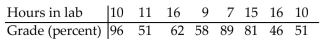 Use linear regression to find a linear function that predicts a student's course grade as a function of the number of hours
Spent in lab.
Use linear regression to find a linear function that predicts a student's course grade as a function of the number of hours
Spent in lab.
(Multiple Choice)
4.8/5 (26)
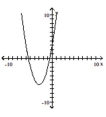
The graph that follows is the graph of a polynomial function. (i) What is the minimum degree of a polynomial function
that could have the graph? (ii) Is the leading coefficient of the polynomial negative or positive?
-
(Multiple Choice)
4.8/5 (39)
Provide an appropriate response.
-For f(t) = 3t + 2 and g(t) = 2 -  find 4f(3) - g(-3) + g(0).
(Short Answer)
4.7/5 (32)
Determine whether the function is linear, constant, or neither
-y - 12 = 0
(Multiple Choice)
4.8/5 (37)
Filters
- Essay(0)
- Multiple Choice(0)
- Short Answer(0)
- True False(0)
- Matching(0)