Exam 1: Functions and Graphs
Exam 1: Functions and Graphs224 Questions
Exam 2: Limits and the Derivative123 Questions
Exam 3: Additional Derivative Topics126 Questions
Exam 4: Graphing and Optimization116 Questions
Exam 5: Integration93 Questions
Exam 6: Additional Integration Topics82 Questions
Exam 7: Multivariable Calculus78 Questions
Exam 8: Trigonometric Functions92 Questions
Exam 9: Differential Equations47 Questions
Exam 10: Taylor Polynomials and Infinite Series48 Questions
Exam 11: Probability and Calculus57 Questions
Exam 12: Basic Algebra Review44 Questions
Exam 13: Special Topics20 Questions
Select questions type
Write an equation for a function that has a graph with the given transformations.
-The shape of  2 is vertically stretched by a factor of 10, and the resulting graph is reflected across the x-axis.
(Multiple Choice)
4.8/5  (41)
(41)
Use the REGRESSION feature on a graphing calculator.
-In the table below, x represents the number of years since 2000 and y represents sales (in thousands of dollars) of a clothing company. Use the regression equation to estimate sales in the year 2006. Round to the nearest
Thousand dollars. 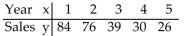
(Multiple Choice)
4.8/5 (35)
Use the REGRESSION feature on a graphing calculator.
-The total cost of the Democratic and the Republican national conventions has increased 596% over the 20-year period between 1980 and 2004. The following table lists the total cost, in millions of dollars, for selected years. 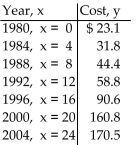 Find the exponential functions that best estimates this data. Round your answer to four decimal places
(Multiple Choice)
4.9/5 (34)
Solve the problem.
-Assume that a person's critical weight W, defined as the weight above which the risk of death rises dramatically, is given by  , where W is in pounds and h is the person's height in inches.
Find the tcritical weight for a person who is 6 ft 11 in. tall. Round to the nearest tenth.
, where W is in pounds and h is the person's height in inches.
Find the tcritical weight for a person who is 6 ft 11 in. tall. Round to the nearest tenth.
(Multiple Choice)
4.8/5 (34)
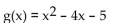
Find the vertex form for the quadratic function. Then find each of the following:
(A) Intercepts
(B) Vertex
(C) Maximum or minimum
(D) Range
-
(Multiple Choice)
4.8/5 (34)
Solve the equation graphically to four decimal places.
-Let f(x) = -0.5x2 + 4x + 2, find f(x) = -5.
(Multiple Choice)
5.0/5 (43)
Solve the problem.
-To estimate the ideal minimum weight of a woman in pounds multiply her height in inches by 4 and subtract 130. Let W = the ideal minimum weight and h = height. Express W as a linear function of h.
(Multiple Choice)
4.9/5 (31)
Use interval notation to write the solution set of the inequality.
-
(Multiple Choice)
4.9/5 (35)
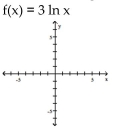
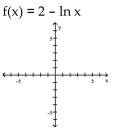
Graph the function using a calculator and point-by-point plotting. Indicate increasing and decreasing intervals.
-
(Multiple Choice)
4.9/5 (43)
Find the slope and y intercept of the graph of the equation.
-y = -4x + 6
(Multiple Choice)
4.8/5 (36)
Determine whether the function is linear, constant, or neither
-
(Multiple Choice)
4.7/5 (41)
Find the slope and y intercept of the graph of the equation.
-
(Multiple Choice)
5.0/5 (31)
Use the REGRESSION feature on a graphing calculator.
-A strain of E-coli Beu-recA441 is placed into a petri dish at 30°Celsius and allowed to grow. The following data are collected. Theory states that the number of bacteria in the petri dish will initially grow according to the law
Of uninhibited growth. The population is measured using an optical device in which the amount of light that
Passes through the petri dish is measured. 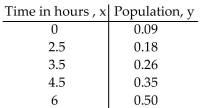 Find the exponential equation in the form
  , where x is the hours of growth. Round to four decimal
Places.
, where x is the hours of growth. Round to four decimal
Places.
(Multiple Choice)
4.9/5 (36)
Provide an appropriate response.
-Only one of the following functions has domain which is not equal to all real numbers. State which function and state its
domain.
(A) 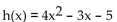 (B)
(B)  (C)
(C) 
(Essay)
4.7/5 (33)
Solve the problem.
-The mathematical model C = 600 x + 30,000 represents the cost in dollars a company has in manufacturing x items during a month. Using this model, how much does it cost to produce 600 items?
(Multiple Choice)
5.0/5 (35)
Use the REGRESSION feature on a graphing calculator.
-The average retail price in the Spring of 2000 for a used Camaro Z28 coupe depends on the age of the car as shown in the following table.  Find the quadratic model that best estimates this data. Round your answer to whole numbers.
(Multiple Choice)
4.9/5 (34)
Graph the function using a calculator and point-by-point plotting. Indicate increasing and decreasing intervals.
-
(Multiple Choice)
4.9/5 (41)
Provide an appropriate response.
-Use the graph to find the slope-intercept form of the equation of the line. 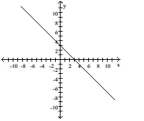
(Multiple Choice)
4.8/5 (33)
Filters
- Essay(0)
- Multiple Choice(0)
- Short Answer(0)
- True False(0)
- Matching(0)