Exam 7: Utility Maximization
Exam 1: Limits, Alternatives, and Choices107 Questions
Exam 2: The Market System and the Circular Flow287 Questions
Exam 3: Demand, Supply, and Market Equilibrium151 Questions
Exam 4: Market Failures Caused by Externalities Asymmetric Information229 Questions
Exam 5: Public Goods, Public Choice, and Government Failure268 Questions
Exam 6: Elasticity399 Questions
Exam 7: Utility Maximization358 Questions
Exam 8: Behavioral Economics311 Questions
Exam 9: Businesses and the Costs of Production445 Questions
Exam 10: Pure Competition in the Short Run342 Questions
Exam 11: Pure Competition in the Long Run250 Questions
Exam 12: Pure Monopoly407 Questions
Exam 13: Monopolistic Competition279 Questions
Exam 14: Oligopoly and Strategic Behavior362 Questions
Exam 15: Technology, RD, and Efficiency309 Questions
Exam 16: The Demand for Resources359 Questions
Exam 17: Wage Determination168 Questions
Exam 18: Rent, Interest, and Profit305 Questions
Exam 19: Natural Resource and Energy Economics337 Questions
Exam 20: Public Finance: Expenditures and Taxes336 Questions
Exam 21: Antitrust Policy and Regulation264 Questions
Exam 22: Agriculture: Economics and Policy265 Questions
Exam 23: Income Inequality, Poverty, and Discrimination324 Questions
Exam 24: Health Care280 Questions
Exam 25: Immigration259 Questions
Exam 26: International Trade347 Questions
Exam 27: The Balance of Payments, Exchange Rates, and Trade Deficits318 Questions
Exam 28: The Economics of Developing Countries277 Questions
Select questions type
The table shows the total utility data for products X and Y. Assume that the prices of X and Y are $3 and $4, respectively, and that consumer income is $18.  If the price of X decreases from $3 to $2, while the price of Y and the consumer's income stay the same, then the utility-maximizing combination is such that the quantity of X
(Multiple Choice)
4.9/5  (33)
(33)
If consumers are convinced by ads that Brand X has a lot more value than they originally thought, then the MU/P of X will decrease.
(True/False)
4.9/5 (42)
To derive the demand curve of a product in indifference curve analysis, the
(Multiple Choice)
4.7/5 (44)
When DVD players start becoming obsolete then, to potential thieves, the
(Multiple Choice)
4.9/5 (37)
As a consumer moves from one point to another along an indifference curve, which of the following is assumed to stay constant?
(Multiple Choice)
4.9/5 (34)
The table shows an indifference schedule for several combinations of X and Y.  How much of X is the consumer willing to give up to obtain the second unit of Y?
(Multiple Choice)
4.9/5 (45)
An increase in the price of product X causes a decrease in the quantity demanded for product X. One basic explanation for this is
(Multiple Choice)
4.8/5 (29)
Mrs. Arnold is spending all her money income by buying bottles of soda and bags of pretzels in such amounts that the marginal utility of the last bottle is 60 utils and the marginal utility of the last bag is 30 utils. The prices of soda and pretzels are $0.6 per bottle and $0.4 per bag, respectively. It can be concluded that
(Multiple Choice)
4.9/5 (29)
 Refer to the table. What is the marginal utility of the fourth unit?
(Multiple Choice)
4.9/5 (36)
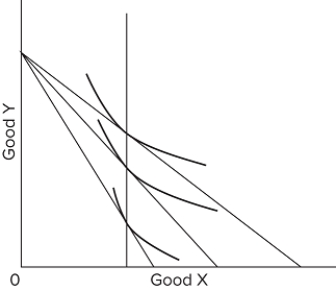 The individual demand curve that is implied by the budget constraints and indifference curves above will be
(Multiple Choice)
4.7/5 (21)
The budget line shows all the combinations of two products that the consumer can buy, given money income and product prices.
(True/False)
4.9/5 (29)
What is shown by the budget line in a two-product (A andB)case? Describe what happens when there is a change in income or the price of a product.
(Essay)
4.9/5 (48)
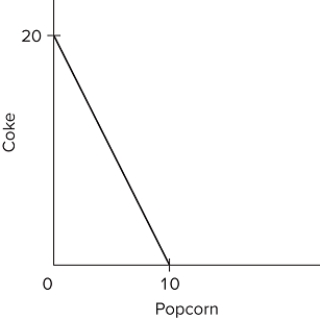 Suppose you have money income of $10, all of which you spend on Coke and popcorn. In the diagram, the prices of Coke and popcorn, respectively, are
(Multiple Choice)
4.8/5 (39)
Noncash gift-giving involves value loss when the marginal utility of the gift to the receiver is less than the product price.
(True/False)
4.8/5 (33)
A child is given $4.00 of pocket money to be spent on either hard candies or chocolates. Chocolates cost 40 cents and hard candies 80 cents each. The marginal utilities derived from each product are as shown in the following table.  Which combination would give the child the maximum utility out of spending $4?
(Multiple Choice)
4.8/5 (44)
If money income increases and the prices of products A and B both increase, then the budget line
(Multiple Choice)
4.8/5 (34)
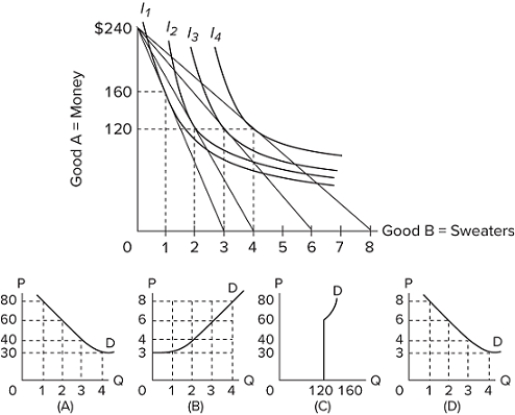 Given the indifference map and budget constraint lines above, what is the demand curve for sweaters?
(Multiple Choice)
4.8/5 (38)
Suppose a consumer has an income of $24, the price of A is $3, and the price of B is $1. Which of the following combinations is on the consumer's budget line?
(Multiple Choice)
4.9/5 (41)
The table shows a consumer's utility schedule.  Based on the data in the table, you can conclude that the
(Multiple Choice)
4.9/5 (38)
The table shows the total utility data for products X and Y. Assume that the prices of X and Y are $2 and $4, respectively, and that consumer income is $18.  How many units of the two products will the consumer buy to get maximum utility?
(Multiple Choice)
4.7/5 (35)
Filters
- Essay(0)
- Multiple Choice(0)
- Short Answer(0)
- True False(0)
- Matching(0)