Exam 7: Utility Maximization
Exam 1: Limits, Alternatives, and Choices107 Questions
Exam 2: The Market System and the Circular Flow287 Questions
Exam 3: Demand, Supply, and Market Equilibrium151 Questions
Exam 4: Market Failures Caused by Externalities Asymmetric Information229 Questions
Exam 5: Public Goods, Public Choice, and Government Failure268 Questions
Exam 6: Elasticity399 Questions
Exam 7: Utility Maximization358 Questions
Exam 8: Behavioral Economics311 Questions
Exam 9: Businesses and the Costs of Production445 Questions
Exam 10: Pure Competition in the Short Run342 Questions
Exam 11: Pure Competition in the Long Run250 Questions
Exam 12: Pure Monopoly407 Questions
Exam 13: Monopolistic Competition279 Questions
Exam 14: Oligopoly and Strategic Behavior362 Questions
Exam 15: Technology, RD, and Efficiency309 Questions
Exam 16: The Demand for Resources359 Questions
Exam 17: Wage Determination168 Questions
Exam 18: Rent, Interest, and Profit305 Questions
Exam 19: Natural Resource and Energy Economics337 Questions
Exam 20: Public Finance: Expenditures and Taxes336 Questions
Exam 21: Antitrust Policy and Regulation264 Questions
Exam 22: Agriculture: Economics and Policy265 Questions
Exam 23: Income Inequality, Poverty, and Discrimination324 Questions
Exam 24: Health Care280 Questions
Exam 25: Immigration259 Questions
Exam 26: International Trade347 Questions
Exam 27: The Balance of Payments, Exchange Rates, and Trade Deficits318 Questions
Exam 28: The Economics of Developing Countries277 Questions
Select questions type
The table shows a consumer's utility schedule.  Based on the data in the table, you can conclude that the
(Multiple Choice)
4.7/5  (41)
(41)
Describe the relationship between raising the marginal cost of crime and the quantity of crime committed. Explain the implications of this relationship as applied to property crimes.
(Essay)
4.8/5 (41)
The table shows a consumer's utility schedule.  Based on the data, you can conclude that the consumer
(Multiple Choice)
4.7/5 (31)
A child is given $4 of pocket money to be spent on either hard candies or chocolates. Chocolates cost 40 cents and hard candies 80 cents each. The marginal utilities derived from each product are as shown in the following table.  Based on taste and preference alone, which good does the child prefer?
(Multiple Choice)
4.8/5 (40)
A consumer is in equilibrium and is spending income in such a way that the marginal utility of product X is 40 units and that of Y is 32 units. If the unit price of X is $5, then the price of Y must be
(Multiple Choice)
4.9/5 (27)
A consumer has an income of $200, and the price of X is $5, while the price of Y is $10. If the consumer buys 8 units of X, then the maximum quantity of Y that she could also buy is
(Multiple Choice)
4.8/5 (42)
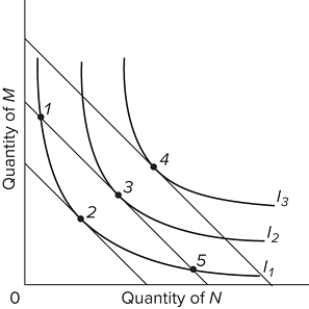 Refer to the diagram, in which the downsloping lines are budget lines and I₁, I₂, and I₃ comprise an indifference map. The combinations of products M and N indicated by points 1, 2, and 5 are such that
(Multiple Choice)
4.9/5 (26)
Assume that a consumer purchases a combination of products Y and Z and that the MU y/ Pᵧ = 48/8 and MU z/ Pz = 30/5. To maximize utility, without spending more money, the consumer should
(Multiple Choice)
4.9/5 (29)
The table shows the marginal-utility schedules for goods A and B for a hypothetical consumer. The price of good A is $1, and the price of good B is $2. The income of the consumer is $8.  If the consumer spends the given budget and gets maximum utility out of it, then she is receiving how much satisfaction from each dollar spent on the final unit of good A consumed?
(Multiple Choice)
4.8/5 (31)
Which of the following best explains why most people don't consume units of goods to the point that their marginal utility falls to zero?
(Multiple Choice)
4.9/5 (39)
The first Pepsi yields Craig 15 units of utility and the second yields him an additional 13 units of utility. His total utility from threecans of Pepsi is 40 units of utility. The marginal utility of the third Pepsi is
(Multiple Choice)
4.8/5 (24)
If a consumer has an income of $200, the price of X is $5, and the price of Y is $10, what is the maximum quantity of X the consumer is able to purchase?
(Multiple Choice)
4.8/5 (34)
Why do people tend to eat more at all-you-can-eat buffet restaurants than at restaurants where each item is purchased separately?
(Multiple Choice)
4.8/5 (37)
The table shows an indifference schedule for several combinations of X and Y.  In moving from combination b to c, the consumer
(Multiple Choice)
4.8/5 (37)
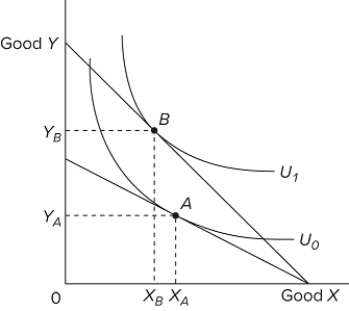 Refer to the diagram. The budget line shift that moves the consumer's equilibrium from point A to point B suggests
(Multiple Choice)
4.9/5 (35)
Which situation is consistent with the law of diminishing marginal utility?
(Multiple Choice)
4.8/5 (28)
Use diminishing marginal utility to explain why millionaires often do not have many homes, even if they can afford it.
(Essay)
4.9/5 (35)
Answer the question on the basis of the following marginal utility data for products X and Y. Assume that the prices of X and Y are $4 and $2, respectively, and that the consumer's income is $18.  What level of total utility will the utility-maximizing consumer realize?
(Multiple Choice)
4.9/5 (38)
The table shows the total utility data for products X and Y. Assume that the prices of X and Y are $3 and $4, respectively, and that consumer income is $18.  Which of the following price-quantity schedules would represent the demand for X in the $2 and $3 price range?

(Multiple Choice)
4.9/5 (42)
Filters
- Essay(0)
- Multiple Choice(0)
- Short Answer(0)
- True False(0)
- Matching(0)