Exam 7: Utility Maximization
Exam 1: Limits, Alternatives, and Choices107 Questions
Exam 2: The Market System and the Circular Flow287 Questions
Exam 3: Demand, Supply, and Market Equilibrium151 Questions
Exam 4: Market Failures Caused by Externalities Asymmetric Information229 Questions
Exam 5: Public Goods, Public Choice, and Government Failure268 Questions
Exam 6: Elasticity399 Questions
Exam 7: Utility Maximization358 Questions
Exam 8: Behavioral Economics311 Questions
Exam 9: Businesses and the Costs of Production445 Questions
Exam 10: Pure Competition in the Short Run342 Questions
Exam 11: Pure Competition in the Long Run250 Questions
Exam 12: Pure Monopoly407 Questions
Exam 13: Monopolistic Competition279 Questions
Exam 14: Oligopoly and Strategic Behavior362 Questions
Exam 15: Technology, RD, and Efficiency309 Questions
Exam 16: The Demand for Resources359 Questions
Exam 17: Wage Determination168 Questions
Exam 18: Rent, Interest, and Profit305 Questions
Exam 19: Natural Resource and Energy Economics337 Questions
Exam 20: Public Finance: Expenditures and Taxes336 Questions
Exam 21: Antitrust Policy and Regulation264 Questions
Exam 22: Agriculture: Economics and Policy265 Questions
Exam 23: Income Inequality, Poverty, and Discrimination324 Questions
Exam 24: Health Care280 Questions
Exam 25: Immigration259 Questions
Exam 26: International Trade347 Questions
Exam 27: The Balance of Payments, Exchange Rates, and Trade Deficits318 Questions
Exam 28: The Economics of Developing Countries277 Questions
Select questions type

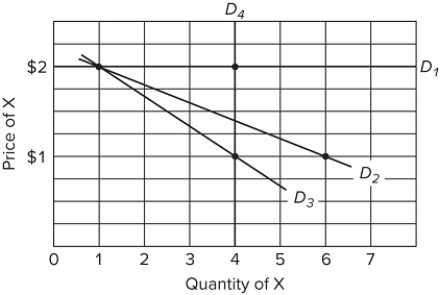 Refer to the table and graph. Suppose that the price of X falls from $2 to $1, while the price of Y remains at $4. Which of the following represents the demand curve for X if the consumer has money income of $10 to spend on X and Y?
(Multiple Choice)
4.9/5  (26)
(26)
A graph that shows the maximum combinations of two goods which a consumer can purchase with a given money income is
(Multiple Choice)
4.8/5 (38)
Frank is purchasing products C and D in utility-maximizing amounts. If the price of C is $4 and the price of D is $2, then
(Multiple Choice)
4.8/5 (35)
If the total utility from consuming five units of a product is 245 and the marginal utility of a sixth unit is 5, then the total utility from consuming six units would be
(Multiple Choice)
4.8/5 (23)
In spending all his income on beer and pizza, Fred finds that the marginal utility of the last pizza he consumed is 8, and the marginal utility of the last bottle of beer is 4. The price of a bottle of beer is $1.50. If Fred has maximized his utility, the price of pizza must be
(Multiple Choice)
4.8/5 (40)
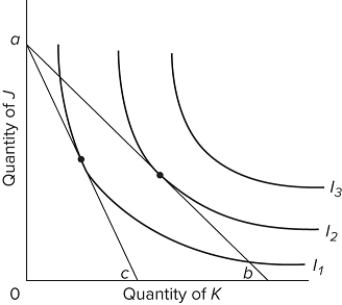 Refer to the diagram. The equilibrium points shown in the diagram, along with the price change that produced the shift of the budget line from ab to ac,
(Multiple Choice)
4.8/5 (32)
How did Apple overcome consumers' diminishing marginal utility for iPads?
(Multiple Choice)
4.8/5 (30)
Assume the price of product Y (the quantity of which is plotted on the vertical axis)is initially $15 and the price of X (the quantity of which is plotted on the horizontal axis)is initially $3. Assume money income is initially $60. If the prices of Y and X now increase to $30 and $6, respectively, and money income increases to $120, then the budget line will
(Multiple Choice)
4.8/5 (24)
If a consumer is initially in equilibrium, an increase in money income will
(Multiple Choice)
4.9/5 (30)
The table shows an indifference schedule for several combinations of X and Y.  In moving from combination a to b, the consumer
(Multiple Choice)
4.8/5 (38)
Answer the question on the basis of the following two schedules, which show the amounts of additional satisfaction (marginal utility)that a consumer would get from successive quantities of products J and K.  What level of total utility is realized from the equilibrium combination of J and K, if the consumer has a money income of $26 and the prices of J and K are $8 and $2, respectively?
(Multiple Choice)
4.9/5 (43)
Answer the question based on the table below showing the marginal utility schedules for product X and product Y for a hypothetical consumer. The price of product X is $4, and the price of product Y is $2. The income of the consumer is $20.  If the consumer buys product X or product Y one unit at a time, which of the following will the consumer's first two purchases be?
(Multiple Choice)
5.0/5 (40)
Frank is purchasing products C and D in utility-maximizing amounts. If the price of C is $6 and the price of D is $3, then
(Multiple Choice)
4.8/5 (34)
Use marginal-utility analysis to explain the growing popularity of iPads and other tablets over laptops and desktop computers.
(Essay)
4.7/5 (27)
Filters
- Essay(0)
- Multiple Choice(0)
- Short Answer(0)
- True False(0)
- Matching(0)