Exam 7: Utility Maximization
Exam 1: Limits, Alternatives, and Choices107 Questions
Exam 2: The Market System and the Circular Flow287 Questions
Exam 3: Demand, Supply, and Market Equilibrium151 Questions
Exam 4: Market Failures Caused by Externalities Asymmetric Information229 Questions
Exam 5: Public Goods, Public Choice, and Government Failure268 Questions
Exam 6: Elasticity399 Questions
Exam 7: Utility Maximization358 Questions
Exam 8: Behavioral Economics311 Questions
Exam 9: Businesses and the Costs of Production445 Questions
Exam 10: Pure Competition in the Short Run342 Questions
Exam 11: Pure Competition in the Long Run250 Questions
Exam 12: Pure Monopoly407 Questions
Exam 13: Monopolistic Competition279 Questions
Exam 14: Oligopoly and Strategic Behavior362 Questions
Exam 15: Technology, RD, and Efficiency309 Questions
Exam 16: The Demand for Resources359 Questions
Exam 17: Wage Determination168 Questions
Exam 18: Rent, Interest, and Profit305 Questions
Exam 19: Natural Resource and Energy Economics337 Questions
Exam 20: Public Finance: Expenditures and Taxes336 Questions
Exam 21: Antitrust Policy and Regulation264 Questions
Exam 22: Agriculture: Economics and Policy265 Questions
Exam 23: Income Inequality, Poverty, and Discrimination324 Questions
Exam 24: Health Care280 Questions
Exam 25: Immigration259 Questions
Exam 26: International Trade347 Questions
Exam 27: The Balance of Payments, Exchange Rates, and Trade Deficits318 Questions
Exam 28: The Economics of Developing Countries277 Questions
Select questions type
The marginal rate of substitution of beef for chicken is the
(Multiple Choice)
4.9/5  (41)
(41)
Assume that a consumer purchases a combination of product A and product B such that the MU ₐ /P ₐ = 8 and MU ᵦ /P ᵦ = 6. To maximize utility without spending more money, the consumer should
(Multiple Choice)
4.9/5 (33)
 Refer to data. Marginal utility becomes negative beginning with the
(Multiple Choice)
4.7/5 (35)
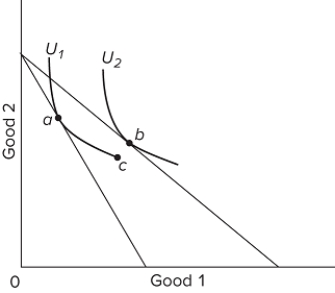 Refer to the graph. As the consumer equilibrium point shifts from point a to point b,
(Multiple Choice)
4.9/5 (41)
The ratio of the prices of two products that a consumer could buy with a given fixed income is equivalent to the
(Multiple Choice)
5.0/5 (40)
A consumer is maximizing her utility with a particular money income when
(Multiple Choice)
4.8/5 (26)
If two combinations of goods X and Y give a consumer equal satisfaction, then these two combinations must both be on the same
(Multiple Choice)
4.7/5 (36)
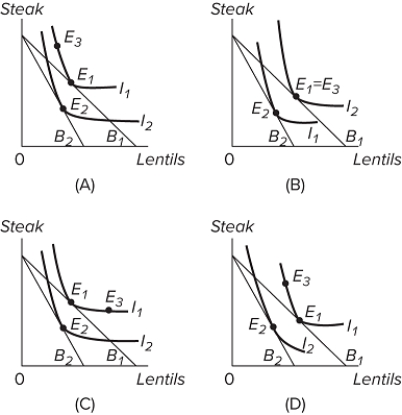 Recently, the price of lentils increased. As a result Lincoln residents noticed that their neighbor, Rasputin, decreased his consumption of lentils and of steak. Rasputin said his utility had declined. Many citizens made donations to the "Rasputin Relief Fund." Rasputin was given a cash grant equal to the amount he claimed to need to regain his initial utility level. Happy and thankful, Rasputin rushed off to the store to make his new purchases-consisting of more steak and slightly less lentils. Each graph above shows two indifference curves for Rasputin, I₁ and I₂, and the two budget constraints, B₁ and B₂, that he faced. Let E₁ represent Rasputin's initial equilibrium, E₂ equal his equilibrium following the increase in the price of lentils, and E₃ his equilibrium after receiving the cash from the relief fund. Which graph above is consistent with Rasputin's claims in the above story?
(Multiple Choice)
4.8/5 (34)
According to economists, gift registries, returning gifts for cash refunds, and "recycling gifts"
(Multiple Choice)
4.9/5 (45)
The table shows the marginal-utility schedules for goods A and B for a hypothetical consumer. The price of good A is $1, and the price of good B is $2. The income of the consumer is $8.  If the price of A decreases, while the price of B and the consumer's income stay the same, we would expect
(Multiple Choice)
4.9/5 (27)
The table below shows the utility schedule for a consumer of candy bars.  This consumer begins to experience diminishing marginal utility when consuming the
(Multiple Choice)
4.8/5 (33)
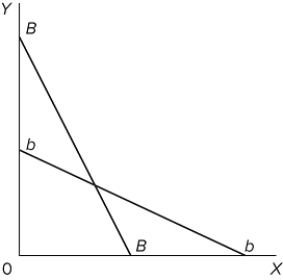 If the budget line shifts from BB to bb in the diagram, we can infer that the
(Multiple Choice)
4.8/5 (33)
Assume that Tonya consumes only two products, pizza and potato chips, out of a given budget. If the price of pizza decreases, then Tonya's consumption of pizza will
(Multiple Choice)
4.9/5 (45)
The table shows the utility schedule for a consumer of candy bars.  Based on the data in the table, you can conclude that the
(Multiple Choice)
4.9/5 (32)
Sharon purchases two products with a given fixed budget, orange juice and soda. Her marginal utility from orange juice is 60, and her marginal utility from soda is 30. The price of a bottle of orange juice is $2.00, and the price of soda is $1.00. These data suggest that
(Multiple Choice)
4.9/5 (31)
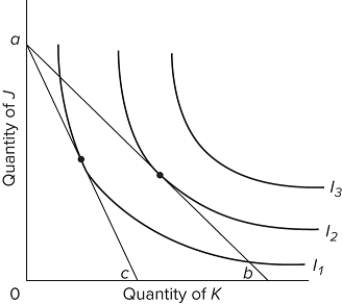 Refer to the diagram. If the budget line shifts from ab to ac, the
(Multiple Choice)
4.7/5 (36)
If MU a/ Pₐ = 20/$3 = MU b/ Pᵦ = 70/? = MU c/ Pc = 100/?, the prices of products B and C in consumer equilibrium
(Multiple Choice)
4.8/5 (36)
Filters
- Essay(0)
- Multiple Choice(0)
- Short Answer(0)
- True False(0)
- Matching(0)