Exam 17: The Phillips Curve and Expectations Theory
Exam 1: Introducing the Economic Way of Thinking176 Questions
Exam 2: Production Possibilities, Opportunity Cost, and Economic Growth200 Questions
Exam 3: Market Demand and Supply348 Questions
Exam 4: Markets in Action261 Questions
Exam 5: Gross Domestic Product223 Questions
Exam 6: Business Cycles and Unemployment194 Questions
Exam 7: Inflation126 Questions
Exam 8: The Keynesian Model235 Questions
Exam 9: The Keynesian Model in Action202 Questions
Exam 10: Aggregate Demand and Supply187 Questions
Exam 11: Fiscal Policy223 Questions
Exam 12: The Public Sector127 Questions
Exam 13: Federal Deficits, Surpluses, and the National Debt99 Questions
Exam 14: Money and the Federal Reserve System154 Questions
Exam 15: Money Creation243 Questions
Exam 16: Monetary Policy213 Questions
Exam 17: The Phillips Curve and Expectations Theory120 Questions
Exam 18: International Trade and Finance248 Questions
Exam 19: Economies in Transition104 Questions
Exam 20: Growth and the Less-Developed Countries117 Questions
Exam 21: Applying Graphs to Economics68 Questions
Exam 22: Consumer Surplus, Producer Surplus, and Market Efficiency68 Questions
Exam 23: the Self-Correcting Aggregate Demand and Supply Model83 Questions
Exam 24: Policy Disputes Using the Self-Correcting Aggregate Demand and Supply Model36 Questions
Select questions type
Exhibit 17-1 Inflation and unemployment rates 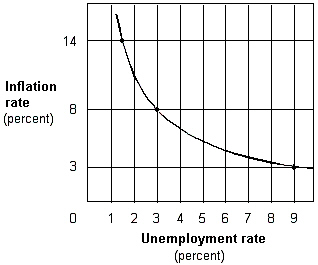 The name of the graph in Exhibit 17-1 is the:
(Multiple Choice)
4.7/5  (42)
(42)
"Preannounced, stable policies to achieve a low and constant money supply growth and a balanced federal budget are therefore the best way to lower the inflation rate." This statement best illustrates the:
(Multiple Choice)
4.9/5 (29)
Rational expectations theory rejects the concept that only unanticipated or surprise policies can influence inflation.
(True/False)
4.9/5 (36)
Exhibit 17-4 Short-run and long-run Phillips curves 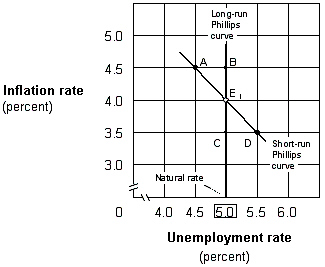 Suppose the economy in Exhibit 17-4 is at point E1, and the Fed increases the money supply. If people have adaptive expectations, then the economy will move:
(Multiple Choice)
4.8/5 (36)
Under adaptive expectations theory, an increase in the short-run aggregate demand curve ____ the inflation rate and ____ the unemployment rate.
(Multiple Choice)
4.8/5 (34)
A graph showing the inverse relationship between the economy's rate of unemployment and rate of inflation is called the:
(Multiple Choice)
4.7/5 (40)
Under the rational expectations hypothesis, which of the following is the most likely short-run effect of a move to expansionary monetary policy?
(Multiple Choice)
4.8/5 (34)
Rational expectations theory is the concept that only unanticipated or surprise policies can influence inflation.
(True/False)
4.8/5 (37)
According to the adaptive expectations theory, after many years of rising prices, people tend to ignore past experience in predicting the future rate of inflation.
(True/False)
4.8/5 (40)
Which economist(s)first identified an inverse relationship between inflation and unemployment?
(Multiple Choice)
4.9/5 (35)
The tradeoff between the inflation rate and unemployment rate is represented by the:
(Multiple Choice)
4.8/5 (43)
Each point on the Phillips curve represents a combination of the:
(Multiple Choice)
4.8/5 (39)
According to rational expectations theory, predictable expansionary monetary and fiscal policies to reduce the unemployment rate are:
(Multiple Choice)
4.9/5 (45)
The long-run Phillips curve is a vertical line at the natural rate of unemployment.
(True/False)
4.8/5 (42)
If the government accelerates money supply growth and enlarges the budget deficit to stimulate aggregate demand, the rational expectations hypothesis indicates that decision makers will:
(Multiple Choice)
4.9/5 (42)
Filters
- Essay(0)
- Multiple Choice(0)
- Short Answer(0)
- True False(0)
- Matching(0)