Exam 17: The Phillips Curve and Expectations Theory
Exam 1: Introducing the Economic Way of Thinking176 Questions
Exam 2: Production Possibilities, Opportunity Cost, and Economic Growth200 Questions
Exam 3: Market Demand and Supply348 Questions
Exam 4: Markets in Action261 Questions
Exam 5: Gross Domestic Product223 Questions
Exam 6: Business Cycles and Unemployment194 Questions
Exam 7: Inflation126 Questions
Exam 8: The Keynesian Model235 Questions
Exam 9: The Keynesian Model in Action202 Questions
Exam 10: Aggregate Demand and Supply187 Questions
Exam 11: Fiscal Policy223 Questions
Exam 12: The Public Sector127 Questions
Exam 13: Federal Deficits, Surpluses, and the National Debt99 Questions
Exam 14: Money and the Federal Reserve System154 Questions
Exam 15: Money Creation243 Questions
Exam 16: Monetary Policy213 Questions
Exam 17: The Phillips Curve and Expectations Theory120 Questions
Exam 18: International Trade and Finance248 Questions
Exam 19: Economies in Transition104 Questions
Exam 20: Growth and the Less-Developed Countries117 Questions
Exam 21: Applying Graphs to Economics68 Questions
Exam 22: Consumer Surplus, Producer Surplus, and Market Efficiency68 Questions
Exam 23: the Self-Correcting Aggregate Demand and Supply Model83 Questions
Exam 24: Policy Disputes Using the Self-Correcting Aggregate Demand and Supply Model36 Questions
Select questions type
Compliance with wage and price controls by unions and businesses is strictly voluntary.
(True/False)
4.8/5  (34)
(34)
Under adaptive expectations theory, people expect the rate of inflation this year to be:
(Multiple Choice)
4.8/5 (34)
Incorporation of expectations into economic decision making indicates that in the long run:
(Multiple Choice)
4.9/5 (31)
During the 1970s, the inflation rate and the unemployment rate were inversely related.
(True/False)
4.9/5 (36)
Exhibit 17-2 Aggregate demand and aggregate supply curves  As shown in Exhibit 17-2, if people behave according to rational expectations theory, an increase in the aggregate demand curve from AD1 to AD2 will cause the price level to move:
(Multiple Choice)
4.9/5 (32)
The Phillips curve shows a negative relationship between the:
(Multiple Choice)
4.8/5 (32)
The view that individuals weigh all available evidence when they formulate their expectations about economic events (including information concerning the probable effects of current and future economic policy)is called:
(Multiple Choice)
4.9/5 (37)
Explain why rational expectations theorists do not support government intervention to alleviate unemployment. Explain their views on the effectiveness of fiscal policy and monetary policy.
(Essay)
4.7/5 (42)
According to the natural rate hypothesis, the unemployment rate should equal 0 percent in the long run.
(True/False)
4.8/5 (37)
Exhibit 17-2 Aggregate demand and aggregate supply curves 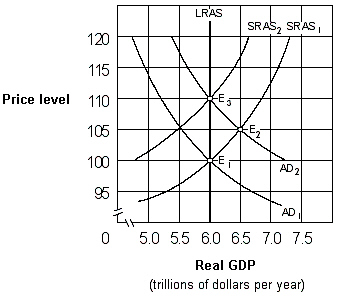 As shown in Exhibit 17-2, if people behave according to adaptive expectations theory, an increase in the aggregate demand curve from AD1 to AD2 will cause the price level to move:
(Multiple Choice)
4.9/5 (44)
What is the difference between the Keynesian and rational expectations theories concerning the success of stabilization policy?
(Essay)
4.7/5 (37)
Which of the following is not an example of an incomes policy?
(Multiple Choice)
4.7/5 (34)
A Phillips curve shows the relationship between the inflation rate and the:
(Multiple Choice)
4.9/5 (37)
The rational expectations hypothesis indicates that people:
(Multiple Choice)
4.9/5 (42)
Experience with the Phillips curve since the 1970s has shown that the:
(Multiple Choice)
4.9/5 (33)
Exhibit 17-1 Inflation and unemployment rates 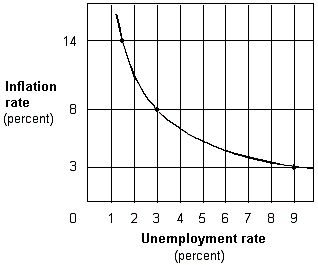 In Exhibit 17-1, when the unemployment rate goes from 9 percent to 1 percent, the:
(Multiple Choice)
4.8/5 (41)
This school of thought argues that because people anticipate the consequences of announced government policy and incorporate these anticipated consequences into their present decision making, people end up undermining the government policy. What is it?
(Multiple Choice)
4.9/5 (36)
Which of the following curves show an inverse relationship between a nation's inflation and unemployment rates?
(Multiple Choice)
4.9/5 (43)
Filters
- Essay(0)
- Multiple Choice(0)
- Short Answer(0)
- True False(0)
- Matching(0)