Exam 3: Inserting Objects Into a Presentation
Exam 1: Creating a Presentation in Powerpoint 2010137 Questions
Exam 2: Modifying a Presentation71 Questions
Exam 3: Inserting Objects Into a Presentation70 Questions
Exam 4: Finishing a Presentation70 Questions
Exam 5: Working With Advanced Tools and Masters71 Questions
Exam 6: Enhancing Charts68 Questions
Exam 7: Inserting Illustrations, Objects and Media Clips71 Questions
Exam 8: Using Advanced Features71 Questions
Exam 9: Web Apps: Working With Windows Live and Office Web Apps65 Questions
Select questions type
Match each term below with the statement that best defines it.
Correct Answer: Verified
Premises:
Responses:
Free
(Matching)
4.8/5  (22)
(22)
Correct Answer:Verified
The vertical axis is also called the ____ axis.
Free
(Multiple Choice)
4.7/5 (34)
Correct Answer:Verified
B
You can insert clip art anywhere on a slide by clicking the ClipArt button in the Graphics group on the Insert tab.
Free
(True/False)
4.8/5 (30)
Correct Answer:Verified
False
To control how cropped images are treated when a PowerPoint file is saved, click options in the ____ dialog box.
(Multiple Choice)
4.9/5 (41)
Maureen's brother Paul has also been researching cruise ships online and has created his own presentation. Maureen and Paul decide to work together to create a great presentation to show to the rest of the family. Paul sends Maureen his slides about offshore excursions and she ____.
(Multiple Choice)
4.9/5 (35)
Every chart has a corresponding ____ that contains the numerical data displayed by the chart.
(Multiple Choice)
4.8/5 (40)
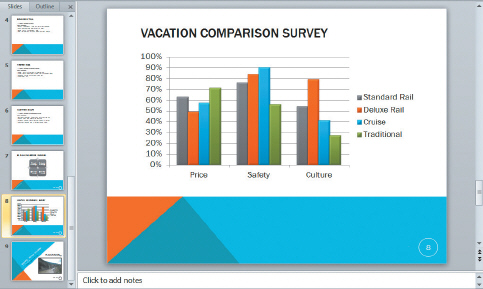 In the chart above, the percentages listed vertically along the left edge of the chart make up the y-axis. This y-axis is also called the ____.
(Multiple Choice)
4.8/5 (21)
You can distribute your presentation as a video. Name three ways that the video can be distributed. What are the three levels of resolution settings, and when would you use each?
(Essay)
4.9/5 (40)
Although you can change a clip's size by dragging a corner sizing handle, you can also scale it to change its size proportionally by a specific percentage or size.
(True/False)
4.7/5 (32)
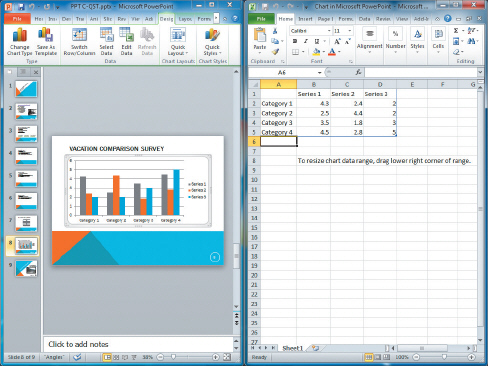 In the figure above, the Design tab that is chosen on the lefthand side of the screen is the ____ Design tab.
(Multiple Choice)
4.9/5 (21)
To ____________________ an object is to change its size by a specific percentage.
(Short Answer)
4.8/5 (40)
You can use the Reset Picture button in the Adjust group to discard formatting changes.
(True/False)
4.9/5 (35)
The ____ chart type shows changes in values in relation to a center point.
(Multiple Choice)
4.8/5 (31)
If you don't have Excel installed, you can create a chart in PowerPoint using a charting program called Microsoft ____________________.
(Short Answer)
4.9/5 (30)
You can create an individual text box by clicking the Text Box button in the Text group on the ___________________ tab on the Ribbon.
(Short Answer)
4.9/5 (48)
If your presentation has numerous slides, you can organize them into sections in the Slides tab.
(True/False)
4.9/5 (33)
You can save your PowerPoint presentation as a full-____ video, which incorporates all slide timings, transitions, animations, and narrations.
(Multiple Choice)
4.9/5 (34)
Once you have created a table, the ____ appears on the Ribbon.
(Multiple Choice)
4.7/5 (34)
If you do not wish to use the content placeholder, you can also insert a chart using the Insert Chart button in the ____ group.
(Multiple Choice)
4.8/5 (40)
Filters
- Essay(0)
- Multiple Choice(0)
- Short Answer(0)
- True False(0)
- Matching(0)