Exam 6: Enhancing Charts
Exam 1: Creating a Presentation in Powerpoint 2010137 Questions
Exam 2: Modifying a Presentation71 Questions
Exam 3: Inserting Objects Into a Presentation70 Questions
Exam 4: Finishing a Presentation70 Questions
Exam 5: Working With Advanced Tools and Masters71 Questions
Exam 6: Enhancing Charts68 Questions
Exam 7: Inserting Illustrations, Objects and Media Clips71 Questions
Exam 8: Using Advanced Features71 Questions
Exam 9: Web Apps: Working With Windows Live and Office Web Apps65 Questions
Select questions type
Animating data markers individually by ____________________ displays the data markers of each series.
(Short Answer)
4.9/5  (39)
(39)
A linked object is stored in its source file, not on a presentation slide such as embedded objects.
(True/False)
4.9/5 (31)
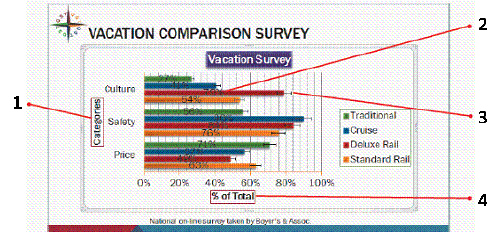 In the figure above, number 1 is pointing to the horizontal axis title.
(True/False)
4.8/5 (28)
A pie chart is designed to display data from one data series in proportion to the sum of all of the data series.
(True/False)
4.8/5 (39)
You can easily add or remove a legend by clicking the Legend button in the Labels group on the Chart Tools ___________________ tab.
(Short Answer)
4.9/5 (39)
In the following situation(s) it would be better to embed an object rather than linking an object: ____.
(Multiple Choice)
4.8/5 (44)
Filters
- Essay(0)
- Multiple Choice(0)
- Short Answer(0)
- True False(0)
- Matching(0)