Exam 6: Enhancing Charts
Exam 1: Creating a Presentation in Powerpoint 2010137 Questions
Exam 2: Modifying a Presentation71 Questions
Exam 3: Inserting Objects Into a Presentation70 Questions
Exam 4: Finishing a Presentation70 Questions
Exam 5: Working With Advanced Tools and Masters71 Questions
Exam 6: Enhancing Charts68 Questions
Exam 7: Inserting Illustrations, Objects and Media Clips71 Questions
Exam 8: Using Advanced Features71 Questions
Exam 9: Web Apps: Working With Windows Live and Office Web Apps65 Questions
Select questions type
The most effective way to show numerical data is to show the data in a table.
(True/False)
4.9/5  (46)
(46)
In the figure above, number 8 is pointing to a ____________________.
(Short Answer)
4.9/5 (40)
Slides with relevant graphics have little impact on a typical audience.
(True/False)
4.9/5 (40)
Explain how a chart is animated. Be sure to describe which parts of the chart can be animated and how the animation works.
(Essay)
4.8/5 (31)
Match each term with its correct description.
Correct Answer: Verified
Premises:
Responses:
(Matching)
4.8/5 (34)
The object you create with a source program is saved in a destination file.
(True/False)
4.8/5 (32)
 -In the figure above, ____ identifies a category axis label.
(Multiple Choice)
4.9/5 (37)
To change the space between data series markers in the chart, ____.
(Multiple Choice)
4.8/5 (39)
____ are small lines of measurement that intersect an axis and identify the categories, values, or series in a chart.
(Multiple Choice)
4.7/5 (40)
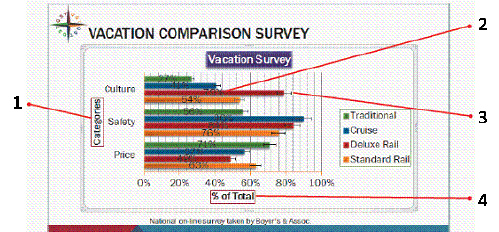 In the figure above, the error bars shown identify potential error amounts relative to each data marker in a(n) ____ series.
(Multiple Choice)
4.9/5 (32)
___________________ identify potential error amounts relative to each data marker in a data series.
(Short Answer)
4.8/5 (33)
You would find a Spanish thesaurus and a word translator in the ____.
(Multiple Choice)
4.9/5 (42)
You have ____ options for individually animating data markers.
(Multiple Choice)
4.8/5 (35)
The orientation setting for the slides is the same as the orientation setting for the notes, handouts, and outline.
(True/False)
4.8/5 (33)
A PowerPoint presentation is primarily a visual communication tool.
(True/False)
4.8/5 (38)
A(n) ___________________ is a graphical representation of an upward or downward trend in a data series, also used to predict future trends.
(Short Answer)
4.9/5 (37)
To change PowerPoint settings, click the ____ tab on the Ribbon, then click Options to open the PowerPoint Options dialog box.
(Multiple Choice)
4.7/5 (31)
Filters
- Essay(0)
- Multiple Choice(0)
- Short Answer(0)
- True False(0)
- Matching(0)