Exam 7: Production, Inputs, and Cost: Building Blocks for Supply Analysis
Exam 1: What Is Economics261 Questions
Exam 2: The Economy: Myth and Reality185 Questions
Exam 3: The Fundamental Economic Problem: Scarcity and Choice290 Questions
Exam 4: Supply and Demand: an Initial Look337 Questions
Exam 5: Consumer Choice: Individual and Market Demand243 Questions
Exam 6: Demand and Elasticity254 Questions
Exam 7: Production, Inputs, and Cost: Building Blocks for Supply Analysis260 Questions
Exam 8: Output, Price, and Profit: the Importance of Marginal Analysis234 Questions
Exam 9: The Financial Markets and the Economy: the Tail That Wags the Dog227 Questions
Exam 10: The Firm and the Industry Under Perfect Competition253 Questions
Exam 11: The Case for Free Markets: the Price System259 Questions
Exam 12: Monopoly244 Questions
Exam 13: Between Competition and Monopoly254 Questions
Exam 14: Limiting Market Power: Antitrust and Regulation155 Questions
Exam 15: The Shortcomings of Free Markets219 Questions
Exam 16: Externalities, Externaliteis, the Environment, and Natural Resources222 Questions
Exam 17: Taxation and Resource Allocation221 Questions
Exam 18: Pricing the Factors of Production233 Questions
Exam 19: Labor and Entrepreneurship: the Human Inputs271 Questions
Exam 20: Poverty, Inequality, and Discrimination171 Questions
Exam 21: International Trade and Comparative Advantage226 Questions
Exam 22: Contemporary Issues in the Us Economy23 Questions
Select questions type
If MPP a \P a = MPP b \P b , then the firm should increase the usage of both input a and input b.
(True/False)
4.7/5  (28)
(28)
If economies of scale exist for a particular production relationship, long-run average costs will
(Multiple Choice)
4.8/5 (33)
In the short run, a firm has fixed costs but never any variable costs.
(True/False)
4.8/5 (32)
If significant economies of scale are present, large firms will be much more efficient producers than small firms.
(True/False)
4.7/5 (33)
Production indifference curves generally have a positive slope.
(True/False)
4.8/5 (34)
Figure 7-12
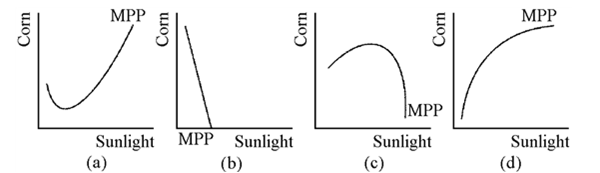 Which of the graphs in Figure 7-12 shows a marginal physical product curve that exhibits first increasing and then diminishing marginal returns to sunlight?
(Multiple Choice)
4.9/5 (35)
A.B. Denson Company had been employing 6 workers and 8 tons of raw materials, using 2,000 square feet of plant space. The firm increased its work force to 12 workers utilizing 16 tons of raw materials in a plant space increased to 4,000 square feet. Total number of units of output increased from 78 to 160. What kind of returns to scale is the firm experiencing? Defend your answer.
(Essay)
4.9/5 (26)
If on a given product indifference curve, a firm is using an insufficient (nonoptimal)amount of one of its inputs,
(Multiple Choice)
4.9/5 (32)
Figure 7-15
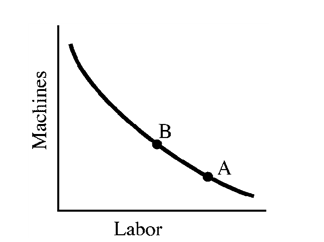 In Figure 7-15, we would expect a move along the production indifference curve from A to B if
(Multiple Choice)
4.8/5 (48)
Draw a long-run average cost curve that first exhibits increasing returns to scale (economies of scale), then constant returns to scale, and finally decreasing returns to scale (diseconomies of scale). Label each region.
(Essay)
4.9/5 (33)
Figure 7-9
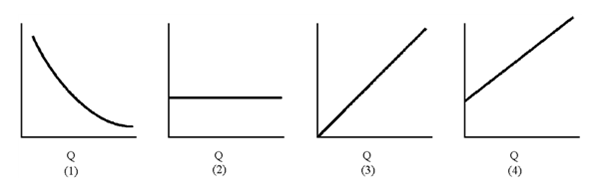 Of the graphs in Figure 7-9, which represents average fixed cost?
(Multiple Choice)
4.7/5 (39)
Figure 7-8
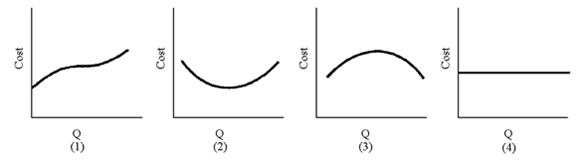 Of the graphs in Figure 7-8, which represents fixed cost?
(Multiple Choice)
5.0/5 (32)
Ray's Barbecue produces about 200 slabs of barbecued ribs per day. The price that Ray pays for each slab of ribs rises by 10 and the rent on Ray's restaurant location rises by 5 percent increase. Marginal cost will increase as a result of
(Multiple Choice)
4.9/5 (29)
At a given level of wheat output, one more unit of labor would produce 10 extra bushels, and one more unit of seed would produce 30 extra bushels. A unit of labor costs $6, and a unit of seed costs $12. The farmer should
(Multiple Choice)
4.8/5 (37)
Filters
- Essay(0)
- Multiple Choice(0)
- Short Answer(0)
- True False(0)
- Matching(0)