Exam 4: Supply and Demand: Applications and Extensions
Exam 1: The Economic Approach210 Questions
Exam 2: Some Tools of the Economist257 Questions
Exam 3: Demand, Supply, and the Market Process585 Questions
Exam 4: Supply and Demand: Applications and Extensions331 Questions
Exam 5: Difficult Cases for the Market, and the Role of Government168 Questions
Exam 6: The Economics of Political Action360 Questions
Exam 7: Consumer Choice and Elasticity223 Questions
Exam 8: Costs and the Supply of Goods231 Questions
Exam 9: Price Takers and the Competitive Process497 Questions
Exam 10: Price-Searcher Markets With Low Entry Barriers216 Questions
Exam 11: Price-Searcher Markets With High Entry Barriers254 Questions
Exam 12: The Supply of and Demand for Productive Resources200 Questions
Exam 13: Earnings, Productivity, and the Job Market109 Questions
Exam 14: Investment, the Capital Market, and the Wealth of Nations129 Questions
Exam 15: Income Inequality and Poverty136 Questions
Exam 16: Applying the Basics: Special Topics in Economics709 Questions
Select questions type
Which of the following would tend to increase the price of lumber?
(Multiple Choice)
4.7/5  (33)
(33)
Use the figure below to answer the following question(s).
Figure 4-13
 Refer to Figure 4-13. The exhibit illustrates the impact of granting a subsidy on a particular good. Which of the following is true for this subsidy given the information provided in the exhibit?
(Multiple Choice)
5.0/5 (41)
Use the figure below to answer the following question(s).
Figure 4-9
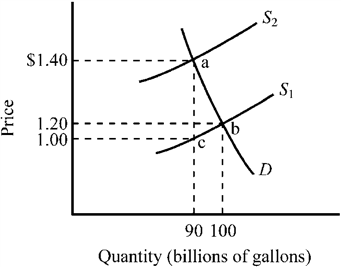 Refer to Figure 4-9. The market for gasoline was initially in equilibrium at point b and a $.40 excise tax is illustrated. What does the triangular area abc represent?
(Multiple Choice)
4.8/5 (44)
Figure 4-17 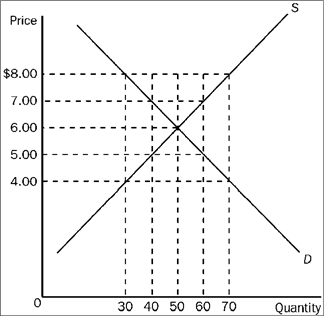 Refer to Figure 4-17. Suppose a price floor of $7.00 is imposed. As a result,
(Multiple Choice)
5.0/5 (42)
Figure 4-24 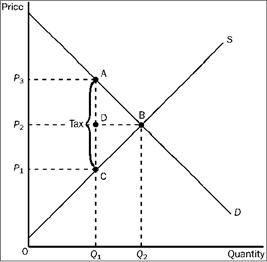 Refer to Figure 4-24. The equilibrium price before the tax is imposed is
(Multiple Choice)
4.9/5 (44)
Figure 4-25 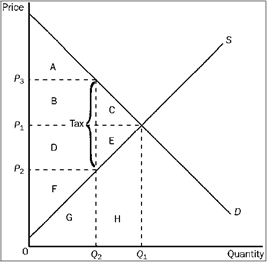 Refer to Figure 4-25. The benefit to the government is
(Multiple Choice)
4.8/5 (36)
Kathy works full time during the day as an economist and faces a 50 percent marginal tax rate. If Kathy were to get an offer to work a second job in the evenings doing consulting work for a local business for $10,000 per year, how much of this additional income would she be able to keep as net pay after taxes?
(Multiple Choice)
4.9/5 (36)
A tax for which the average tax rate rises with income is defined as a
(Multiple Choice)
4.9/5 (25)
When a tax is imposed on a good, the actual incidence of the tax generally
(Multiple Choice)
4.7/5 (32)
Which of the following examples illustrates a regressive income tax?
(Multiple Choice)
4.9/5 (36)
Suppose that a tax is placed on textbooks. If the buyers end up bearing most of the tax burden, this indicates that the
(Multiple Choice)
5.0/5 (38)
When a supply and demand model is used to analyze the market for labor,
(Multiple Choice)
4.8/5 (36)
The burden of a tax will fall primarily on buyers when the
(Multiple Choice)
4.8/5 (23)
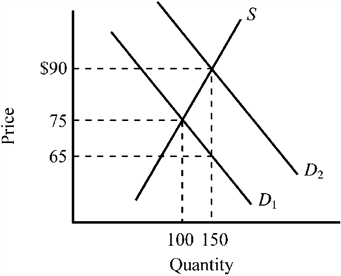
Use the figure below to answer the following question(s).
Figure 4-12
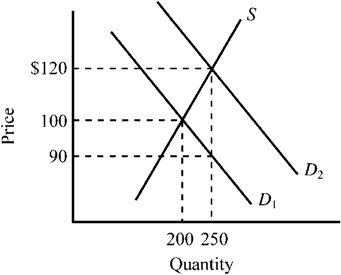 Refer to Figure 4-12. The supply curve S and the demand curve D 1 indicate initial conditions in the market for college textbooks. A new government program is implemented that grants students a $30 per textbook subsidy on every textbook they purchase, shifting the demand curve from D 1 to D 2. Which of the following is true for this subsidy given the information provided in the exhibit?
(Multiple Choice)
5.0/5 (41)
Filters
- Essay(0)
- Multiple Choice(0)
- Short Answer(0)
- True False(0)
- Matching(0)