Exam 4: Supply and Demand: Applications and Extensions
Exam 1: The Economic Approach210 Questions
Exam 2: Some Tools of the Economist257 Questions
Exam 3: Demand, Supply, and the Market Process585 Questions
Exam 4: Supply and Demand: Applications and Extensions331 Questions
Exam 5: Difficult Cases for the Market, and the Role of Government168 Questions
Exam 6: The Economics of Political Action360 Questions
Exam 7: Consumer Choice and Elasticity223 Questions
Exam 8: Costs and the Supply of Goods231 Questions
Exam 9: Price Takers and the Competitive Process497 Questions
Exam 10: Price-Searcher Markets With Low Entry Barriers216 Questions
Exam 11: Price-Searcher Markets With High Entry Barriers254 Questions
Exam 12: The Supply of and Demand for Productive Resources200 Questions
Exam 13: Earnings, Productivity, and the Job Market109 Questions
Exam 14: Investment, the Capital Market, and the Wealth of Nations129 Questions
Exam 15: Income Inequality and Poverty136 Questions
Exam 16: Applying the Basics: Special Topics in Economics709 Questions
Select questions type
Currently, federal and state gasoline taxes (imposed statutorily on the sellers of gasoline) amount to about $.45 per gallon. Suppose the current price of gasoline is $1.20 per gallon, and that if the tax was not in place, the price would be only $.80.
Free
(Multiple Choice)
4.8/5  (37)
(37)
Correct Answer: Verified
C
Whenever a shortage occurs (for example, in parking spaces), and the price does not rise or is not permitted to rise, some method of non-price rationing must occur (for example, driving around looking for a parking space). Which of the following is an advantage of price rationing relative to non-price rationing methods?
Free
(Multiple Choice)
4.9/5 (45)
Correct Answer:Verified
D
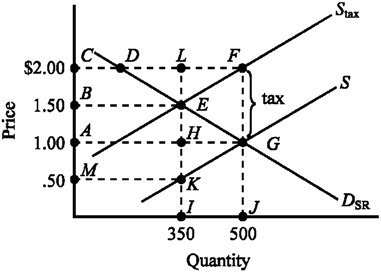
Figure 4-25 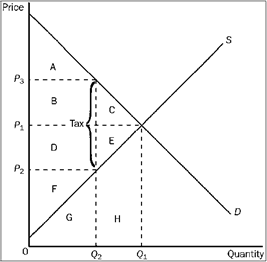 Refer to Figure 4-25. After the tax is levied, producer surplus is represented by area
Free
(Multiple Choice)
4.8/5 (38)
Correct Answer:Verified
D
A law establishing a minimum legal price for a good or service (the minimum wage for example) is known as
(Multiple Choice)
4.8/5 (43)
If a government price control succeeds in affecting price, it can be expected to lead to a corresponding
(Multiple Choice)
5.0/5 (39)
Use the table below to choose the correct answer.
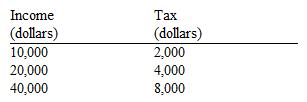 The tax schedule shown here is
(Multiple Choice)
4.7/5 (28)
If a household has $40,000 in taxable income and its tax liability is $10,000, the household's average tax rate is
(Multiple Choice)
4.9/5 (38)
In the two decades following 1990, subsidized federal loans per full-time student more than tripled. Economic analysis indicates that this expansion in subsidies
(Multiple Choice)
4.7/5 (36)
If political officials want to minimize the excess burden accompanying a tax, they should set the tax at a rate
(Multiple Choice)
4.9/5 (37)
Which of the following would tend to increase the wage of coal miners?
(Multiple Choice)
4.8/5 (36)
If Heather's tax liability increases from $10,000 to $16,000 when her income increases from $30,000 to $40,000, her marginal tax rate is
(Multiple Choice)
4.7/5 (36)
Use the figure below to answer the following question(s).
Figure 4-10
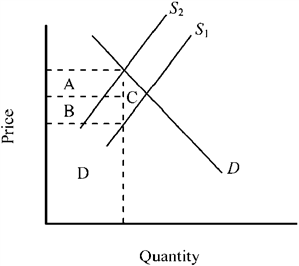 Refer to Figure 4-10. The accompanying graph shows the market for a good before and after an excise tax is imposed. The total tax revenue generated is indicated by
(Multiple Choice)
4.8/5 (38)
A price floor that sets the price of a good above market equilibrium will cause
(Multiple Choice)
4.9/5 (28)
Use the figure below to answer the following question(s).
Figure 4-8
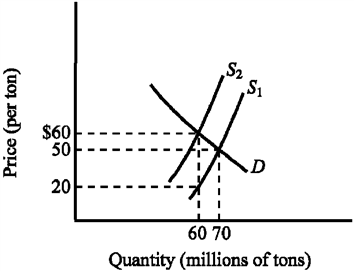 Refer to Figure 4-8. The supply curve S 1 and the demand curve D indicate initial conditions in the market for soft coal. A $40-per-ton tax on soft coal is levied, shifting the supply curve from S 1 to S 2. Imposing the tax increases the equilibrium price of soft coal from
(Multiple Choice)
4.8/5 (32)
Use the figure below illustrating the impact of an excise tax to answer the following question(s).
Figure 4-6
 The revenue generated by the tax illustrated in Figure 4-6 is given by the area
(Multiple Choice)
4.8/5 (33)
Filters
- Essay(0)
- Multiple Choice(0)
- Short Answer(0)
- True False(0)
- Matching(0)