Exam 10: Dynamic Change, Economic Fluctuations, and the Ad--As Model
Exam 1: The Economic Approach185 Questions
Exam 2: Some Tools of the Economist204 Questions
Exam 3: Demand, Supply, and the Market Process339 Questions
Exam 4: Supply and Demand: Applications and Extensions268 Questions
Exam 5: Difficult Cases for the Market, and the Role of Government134 Questions
Exam 6: The Economics of Political Action161 Questions
Exam 7: Taking the Nations Economic Pulse222 Questions
Exam 8: Economic Fluctuations, Unemployment, and Inflation182 Questions
Exam 9: An Introduction to Basic Macroeconomic Markets219 Questions
Exam 10: Dynamic Change, Economic Fluctuations, and the Ad--As Model193 Questions
Exam 11: Fiscal Policy: The Keynesian View and the Historical Development of Macroeconomics112 Questions
Exam 12: Fiscal Policy: Incentives, and Secondary Effects154 Questions
Exam 13: Money and the Banking System198 Questions
Exam 14: Modern Macroeconomics and Monetary Policy204 Questions
Exam 15: Stabilization Policy, Output, and Employment170 Questions
Exam 16: Creating an Environment for Growth and Prosperity125 Questions
Exam 17: Institutions, Policies, and Cross-Country Differences in Income and Growth115 Questions
Exam 18: Gaining From International Trade182 Questions
Exam 19: International Finance and the Foreign Exchange Market148 Questions
Exam 20: Special Topics274 Questions
Select questions type
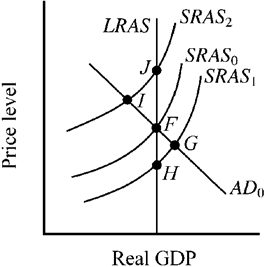
Use the figure below to answer the following question(s). Figure 10-4
 Starting from long-run equilibrium at point F in Figure 10-4, at which of the following points would short-run equilibrium occur following a drought in the Midwestern states?
(Multiple Choice)
4.8/5  (23)
(23)
Other things constant, an increase in resource prices will
(Multiple Choice)
4.9/5 (35)
Use the figure below to answer the following question(s). Figure 10-14
 The economy's initial aggregate demand (AD0) and aggregate supply (SRAS0 and LRAS) curves are illustrated in Figure 10-14. Which of the following is true?
(Multiple Choice)
4.8/5 (33)
If business decision makers expect that the inflation rate will increase in the near future,
(Multiple Choice)
4.8/5 (41)
Use the figure below to answer the following question(s). Figure 10-16
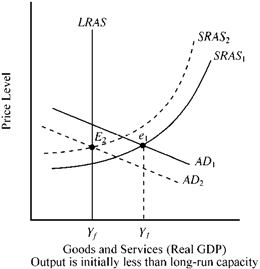
 Suppose an economy is currently operating at output Y1 associated with AD1 and SRAS1, shown in Figure 10-16. Initially, the output of this economy is
(Multiple Choice)
4.9/5 (34)
Which of the following will most likely occur as the result of an unanticipated increase in aggregate demand that pushes output beyond long-run capacity?
(Multiple Choice)
4.8/5 (33)
Use the figure below to answer the following question(s). Figure 10-5
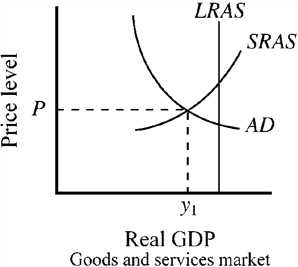 Figure 10-5 indicates that the output of the economy is
(Multiple Choice)
4.9/5 (35)
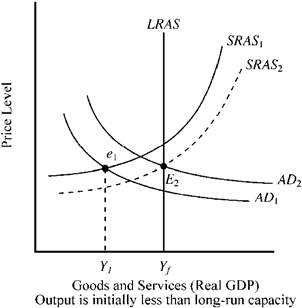
Use the figure below to answer the following question(s). Figure 10-15
 The economy's short-run (SRAS ) and long-run (LRAS) aggregate supply curves are shown in Figure 10-15, along with three alternative aggregate demand curves and the accompanying equilibrium points. At which point will resource prices naturally tend to increase?
(Multiple Choice)
4.7/5 (40)
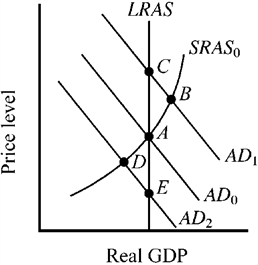
Figure 10-18 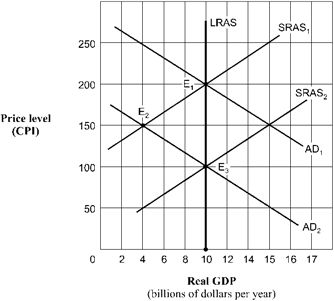 Given the shift of the aggregate demand curve from AD1 to AD2 in Figure 10-18, the real GDP and price level (CPI) in long-run equilibrium will be
(Multiple Choice)
4.9/5 (35)
An abnormally large grain crop due to highly favorable weather conditions in the Midwest is an example of
(Multiple Choice)
4.8/5 (39)
Suppose there is an unexpected increase in real interest rates. Using the AD/AS model, describe the effects of this policy in the long run and the short run, assuming everything else equal.
(Essay)
4.8/5 (33)
An improvement in technology would shift which of the following curve(s)?
(Multiple Choice)
4.9/5 (20)
If European economies experience strong economic growth, U.S. net exports will
(Multiple Choice)
4.9/5 (31)
A large grain crop resulting from favorable weather conditions would shift which of the following curves?
(Multiple Choice)
4.8/5 (36)
For the following changes in the economy, indicate whether short-run aggregate supply or long-run aggregate supply will be affected. Indicate the direction of the change.
a.an improvement in manufacturing technology
b.an increase in the world price of antimony (a chemical that the U.S. imports)
c.a bumper potato crop in the southern "potato belt"
(Essay)
4.9/5 (35)
When an economy is experiencing an economic boom and operating beyond its long-run capacity,
(Multiple Choice)
4.9/5 (38)
Which of the following would be most likely to cause a reduction in current aggregate demand in the United States?
(Multiple Choice)
5.0/5 (28)
Use the figure below to answer the following question(s). Figure 10-17
 With the passage of time, which of the following will tend to direct this economy in Figure 10-17 toward its long-run sustainable rate of output?
(Multiple Choice)
4.9/5 (28)
A rise in the price of oil would be most likely to cause which of the following in the United States?
(Multiple Choice)
4.8/5 (51)
Filters
- Essay(0)
- Multiple Choice(0)
- Short Answer(0)
- True False(0)
- Matching(0)