Exam 1: Functions and Linear Models
Exam 1: Functions and Linear Models100 Questions
Exam 2: Nonlinear Functions and Models88 Questions
Exam 3: Introduction to the Derivative140 Questions
Exam 4: Techniques of Differentiation With Applications106 Questions
Exam 5: Further Applications of the Derivative85 Questions
Exam 6: The Integral71 Questions
Exam 7: Further Integration Techniques and Applications of the Integral117 Questions
Exam 8: Functions of Several Variables133 Questions
Exam 9: Trigonometric Models66 Questions
Select questions type
Decide which of the two given functions is linear and find its equation. 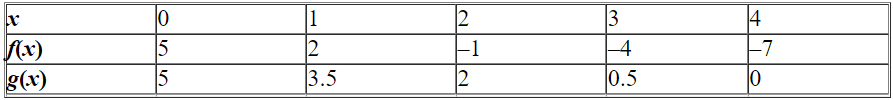 Please enter your answer as an equation of a linear function.
(Essay)
4.9/5  (38)
(38)
The number of research articles in Physics Review that were written by researchers in the U.S. from 1983 through 2003 can be approximated by 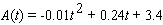 billion dollars (
  is time in years since 1983). Find an appropriate domain of
  .
.
(Multiple Choice)
4.8/5 (32)
In the Fahrenheit temperature scale, water freezes at 32 F and boils at 212 F. In the Celsius (or centigrade)scale, water freezes at 0 C and boils at 100 C. Assuming that the Fahrenheit temperature  and the Celsius temperature
  are related by a linear equation, find the Celsius temperature that correspond to 68 F, to the nearest degree.
(Multiple Choice)
4.8/5 (36)
You can sell 80 pet chias per week if they are marked as $4 each, but only 30 per week if they are marked $5 per chia. Your chia supplier is prepared to sell you 20 chias per week if they are marked $4 per chia, and 70 per week if they are marked $5 per chia. Write the associated linear demand and supply functions.
(Multiple Choice)
4.7/5 (38)
Estimate the slope of the line segment. 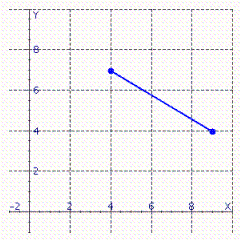 Please enter your answer as a fraction if necessary.
(Short Answer)
4.8/5 (40)
Find the linear equation that is the straight line through (1, 1)with slope 3.
(Multiple Choice)
4.9/5 (39)
The percentage  of children who are able to speak in at least single words by the age of
  months can be approximated by the equation.
 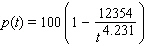 What percent of children are able to speak in at least single words by the age of 11 months? Round to the nearest percent.
(Multiple Choice)
4.8/5 (29)
Find the linear equation that is the straight line through (9, 5)and parallel to the line  .
.
(Multiple Choice)
4.8/5 (32)
Calculate the slope of the straight line through the points (4.1, 1)and (9.1, -14). Try to do the calculations mentally.
(Short Answer)
4.8/5 (34)
Use technology (such as spreadsheet web site utilities, or a graphing calculator)to evaluate the function for  .
.  Round the answer to four decimal places if necessary.
(Multiple Choice)
4.8/5 (26)
a)Find correlation coefficient to the set of data. Round the answer to 4 decimal places, if necessary. 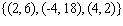 r = __________ b)Find correlation coefficient to the set of data. Round the answer to 4 decimal places, if necessary.
 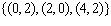 r = __________ c)Find correlation coefficient to the set of data. Round the answer to 4 decimal places, if necessary.
 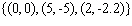 r = __________ Use correlation coefficients to determine which of the given sets of data is best fit by its associated regression line. __________ Use correlation coefficients to determine which of the given sets of data is worst fit by its associated regression line. __________ Is it a perfect fit for any of the data sets? __________
(Short Answer)
4.8/5 (35)
The following table shows the approximate value V of one Euro in U.S, dollars from its introduction in January 2000 to January 2004. (  represents January, 2000.)
 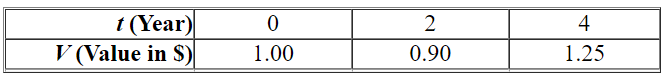 Which model would best fit the given data? ( A , a , b , c , k , l , and m are constants.)
(Multiple Choice)
4.7/5 (32)
The position of a model train, in feet along the railroad track, is given by  after
after  seconds. Where is the train after 10 seconds?
(Multiple Choice)
4.7/5 (26)
Filters
- Essay(0)
- Multiple Choice(0)
- Short Answer(0)
- True False(0)
- Matching(0)