Exam 1: Functions and Linear Models
Exam 1: Functions and Linear Models100 Questions
Exam 2: Nonlinear Functions and Models88 Questions
Exam 3: Introduction to the Derivative140 Questions
Exam 4: Techniques of Differentiation With Applications106 Questions
Exam 5: Further Applications of the Derivative85 Questions
Exam 6: The Integral71 Questions
Exam 7: Further Integration Techniques and Applications of the Integral117 Questions
Exam 8: Functions of Several Variables133 Questions
Exam 9: Trigonometric Models66 Questions
Select questions type
Decide which of the two given functions is linear and find its equation. 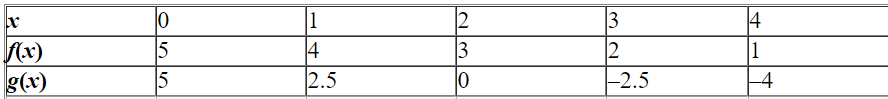
(Multiple Choice)
4.8/5  (41)
(41)
The table shows the number of fiber-optic cable connections to homes in the U.S. from 2000-2004 (  represents 2000). Use technology to obtain the linear regression line, with regression coefficients rounded to two decimal places.
(Multiple Choice)
4.8/5 (37)
Following are approximate values of the Amex Gold BUGS Index. 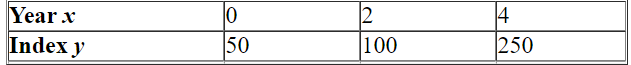 (
(  represents 2000)Obtain the associated regression line. (Round coefficients to 2 decimal places if necessary.)Use your regression equation to project the 2001 sales.
(Multiple Choice)
4.9/5 (48)
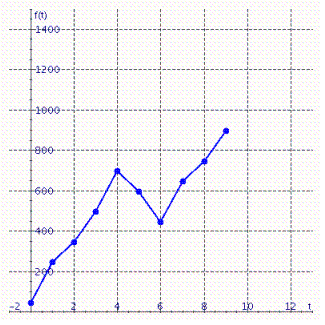
Graph shows the number of sports utility vehicles  sold in the United States.
  represents sales in year
  in thousands of vehicles. Find
  .
. 
(Multiple Choice)
4.9/5 (40)
The Snowtree cricket behaves in a rather interesting way: The rate at which it chirps depends linearly on the temperature. One summer evening you hear a cricket chirping at a rate of 140 chirps per minute, and you notice that the temperature is 80°F. Later in the evening, the cricket has slowed down to 120 chirps per minute, and you notice that the temperature has dropped to 75°F. What is the temperature if the cricket is chirping at a rate of 108 chirps per minute?
(Multiple Choice)
4.8/5 (41)
U.S. imports of pasta increased from 290 million pounds in 1990 ( t = 0), by an average of 52 million pounds per year. Estimate U.S. pasta import (in million pounds)in the year 2010, assuming the import trend continued.
(Multiple Choice)
4.8/5 (37)
In 2004 the Texas Bureau of Economic Geology published a study on the economic impact of using carbon dioxide enhanced oil recovery (EOR)technology to extract additional oil from fields that have reached the end of their conventional economic life. The table gives the approximate number of jobs for the citizens of Texas that would be created at various levels of recovery. Find the regression line.  y = __________ x + __________ Use the regression line to estimate the number of jobs that would be created at a recovery level of 39%.
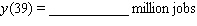
(Short Answer)
4.8/5 (37)
Find the linear equation that is the straight line through  with slope
  .
.
(Multiple Choice)
4.8/5 (27)
Following are some approximate values of the Amex Gold BUGS Index. Year 2003 2004 2006 Index 100 250 300 Take  to be the year since 2003 and
  to be the BUGS index.
(a)Model the 2003 and 2004 data with a linear equation. y = __________
(B)Model the 2004 and 2006 data with a linear equation. y = __________
(c)Use the results of parts (a)and
(B)to obtain a piecewise linear model of the gold BUGS index for 2003-2006.
to be the BUGS index.
(a)Model the 2003 and 2004 data with a linear equation. y = __________
(B)Model the 2004 and 2006 data with a linear equation. y = __________
(c)Use the results of parts (a)and
(B)to obtain a piecewise linear model of the gold BUGS index for 2003-2006. 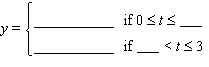 (D)Use your model to estimate the index in 2005. y = __________
(Short Answer)
4.9/5 (41)
Following are forecasts of worldwide annual cell phone handset sales.  ( x = 3 represents 2003)Obtain the associated regression line. (Round coefficients to 2 decimal places if necessary.)Use your regression equation to project the 2015 sales.
(Multiple Choice)
4.9/5 (30)
The percentage  of children who are able to speak in at least single words by the age of
  months can be approximated by the equation.
 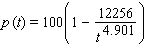 By what age are 60% of children speaking in at least single words? Round your answer to the nearest month.
(Multiple Choice)
4.8/5 (30)
The processor speed, in megahertz, of Intel processors could be approximated by the function of time  in years since the start of 1995.
 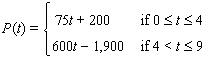 Use the model to estimate when processor speeds first hit 3.2 gigahertz (1 gigahertz = 1,000 megahertz).
(Multiple Choice)
4.8/5 (44)
The value of the Conference Board Index of 10 economic indicators in the U.S. could be approximated by the function of time  in months since the end of December 2002.
 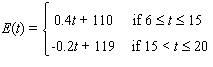 Use the model to estimate when - prior to March, 2004 - the index was 113.
(Multiple Choice)
4.8/5 (36)
Filters
- Essay(0)
- Multiple Choice(0)
- Short Answer(0)
- True False(0)
- Matching(0)