Exam 1: Functions and Linear Models
Exam 1: Functions and Linear Models100 Questions
Exam 2: Nonlinear Functions and Models88 Questions
Exam 3: Introduction to the Derivative140 Questions
Exam 4: Techniques of Differentiation With Applications106 Questions
Exam 5: Further Applications of the Derivative85 Questions
Exam 6: The Integral71 Questions
Exam 7: Further Integration Techniques and Applications of the Integral117 Questions
Exam 8: Functions of Several Variables133 Questions
Exam 9: Trigonometric Models66 Questions
Select questions type
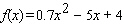
Use technology (such as spreadsheet web site utilities, or a graphing calculator)to evaluate the function for  .
. 
(Multiple Choice)
4.8/5  (30)
(30)
If the income  is specified as a function of selling price
  , which variable is independent and which one is dependent? Choose the correct letter for each question.
is specified as a function of selling price , which variable is independent and which one is dependent? Choose the correct letter for each question.


Correct Answer: Verified
Premises:
Responses:
(Matching)
4.8/5 (42)
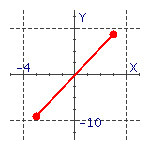
Find the equation of the given linear function.  Please enter your answer as an equation of a linear function.
(Essay)
4.9/5 (36)
The position of a model train, in feet along the railroad track, is given by  after
after  seconds. When will the train have moved a distance of 30 feet?
(Multiple Choice)
4.7/5 (35)
The table shows soybean production, in millions of tons, in Brazil's Cerrados region, as a function of the cultivated area, in millions of acres. Use technology to obtain the regression line. Round coefficients to two decimal places. 
(Multiple Choice)
4.8/5 (36)
Calculate the slope of the straight line through the points (4, 1)and (6, -5). Try to do the calculations mentally.
(Short Answer)
4.9/5 (31)
Find the linear equation that is the straight line through (3, 5)and (9, 23). Please enter your answer as an equation in the form  .
.
(Essay)
4.9/5 (46)
The chart shows second quarter total retail e-commerce sales in the U.S. in 1999, 2001 and 2003 (  represents 1999). Find the regression line. Round coefficients to two decimal places. Year t 0 2 4 Sales ($ Billion)4 8 13 Use the regression line to estimate second quarter retail e-commerce sales in 2002. Round your answer to two decimal places.
(Multiple Choice)
4.9/5 (37)
In the Fahrenheit temperature scale, water freezes at 32 F and boils at 212 F. In the Celsius (or centigrade)scale, water freezes at 0 C and boils at 100 C. Assuming that the Fahrenheit temperature  and the Celsius temperature
  are related by a linear equation, find the Fahrenheit temperature that correspond to 31 C, to the nearest degree.
(Multiple Choice)
4.8/5 (40)
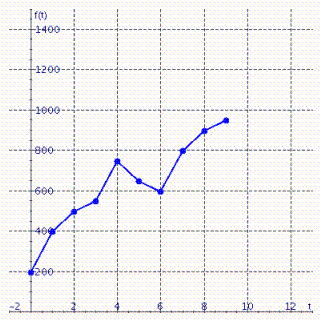
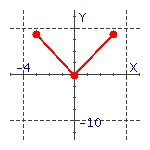
Graph shows the number of sports utility vehicles  sold in the United States.
  represents sales in year
  in thousands of vehicles. Find
  .
. 
(Multiple Choice)
4.8/5 (35)
The following table shows the approximate average household income in the U.S. in 1995, 2002, and 2003. (  represents 1995.)
 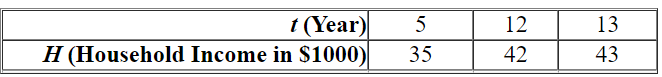 Which of the following kinds of models would best fit the given data? ( A , a , b , c , and m are constants.)
(Multiple Choice)
4.9/5 (34)
In 1950 the number of retirees was approximately 150 per thousand people aged 20-64. In 1990 this number rose to approximately 200, and it is projected to rise to 275 in 2020. Model  as a piecewise linear function of the time
  in years since 1950, and use your model to project the number of retires per thousand people aged 20-64 in 1955. (Round you answer to the nearest integer.)
(Multiple Choice)
4.7/5 (37)
The value of U.S. trade with China from 1994 through 2001 can be approximated by 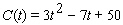 billion dollars (
  is time in years since 1994). Find an appropriate domain of
  .
.
(Multiple Choice)
4.8/5 (35)
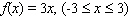
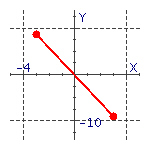
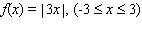
Match each function with the corresponding graph.

Correct Answer:Verified
Premises:
Responses:
(Matching)
5.0/5 (26)
Filters
- Essay(0)
- Multiple Choice(0)
- Short Answer(0)
- True False(0)
- Matching(0)