Exam 3: Introduction to the Derivative
Exam 1: Functions and Linear Models100 Questions
Exam 2: Nonlinear Functions and Models88 Questions
Exam 3: Introduction to the Derivative140 Questions
Exam 4: Techniques of Differentiation With Applications106 Questions
Exam 5: Further Applications of the Derivative85 Questions
Exam 6: The Integral71 Questions
Exam 7: Further Integration Techniques and Applications of the Integral117 Questions
Exam 8: Functions of Several Variables133 Questions
Exam 9: Trigonometric Models66 Questions
Select questions type
Determine what, if any, value to assign to f ( a )to make f continuous at x = a . 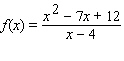 ;
; 
(Not Answered)
This question doesn't have any answer yet
Calculate the average rate of change of the given function f over the intervals  , where h = 5, 0.5, 0.05, 0.005, and 0.0005. (It will be easier to do this if you first simplify the difference quotient ( dq )as much as possible.)
 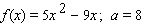 Complete the table.
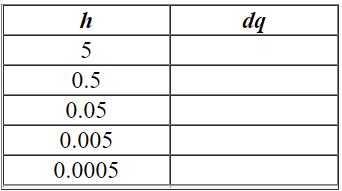
(Multiple Choice)
4.9/5  (36)
(36)
The chart shows the total annual support for the arts in the U.S. by federal, state, and local government in 1995-2003 as a function of time in years (  represents 1995)together with the regression line.
 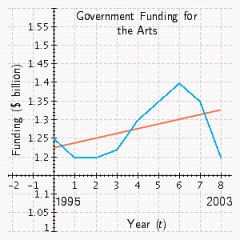 Over the period
  the average rate of change of government funding for the arts was _____ the rate predicted by the regression line.
(Multiple Choice)
4.8/5 (33)
Calculate the average rate of change of the given function over the interval  . x 3 4 5 6 f ( x )5 15 4 9
(Not Answered)
This question doesn't have any answer yet
At which labeled point is the slope of the tangent greatest? 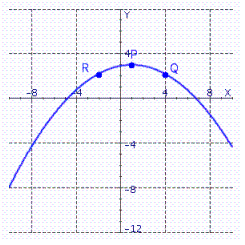
(Multiple Choice)
5.0/5 (43)
Determine what, if any, value to assign to f ( a )to make f continuous at x = a . 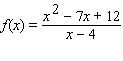 ;
; 
(Multiple Choice)
4.8/5 (41)
Use a graph to determine whether the given function is continuous on its domain. If it is not continuous on its domain, list the points of discontinuity. 
(Multiple Choice)
4.7/5 (24)
The graph of a function  is given. Determine whether
  is continuous on its domain.
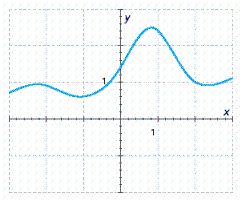
(Multiple Choice)
5.0/5 (37)
Estimate the derivative of the function  at the point
  . Please round your answer to the nearest hundredth.
(Not Answered)
This question doesn't have any answer yet
The number of visitors, in millions of visitors per year, to Hawaii in the years 1985 to 1993 can be approximated by 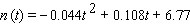 where t = 0 represents June 30,1985. During the same period, visitor spending can be approximated by
 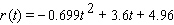 where t = 0 represents June 30,1985.Assuming the trends in the models above continue indefinitely, numerically estimate
  . Please round the answers to the nearest hundredth.
(Multiple Choice)
4.8/5 (42)
Calculate the average rate of change of the given function f over the intervals  , where h = 5, 0.5, 0.05, 0.005, and 0.0005. (It will be easier to do this if you first simplify the difference quotient ( dq )as much as possible.)
 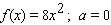 Complete the table.
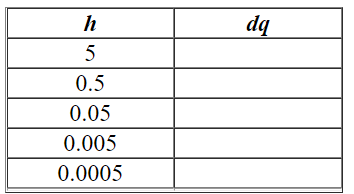
(Multiple Choice)
4.8/5 (40)
Find an equation of the tangent line to the graph of the function  at the point that has x -coordinate
  . Hint : use point-slope formula to find the equation of the tangent line.
(Multiple Choice)
4.8/5 (32)
Filters
- Essay(0)
- Multiple Choice(0)
- Short Answer(0)
- True False(0)
- Matching(0)