Exam 6: Correlational Methods and Statistics
Exam 1: Thinking Like a Scientist55 Questions
Exam 2: Getting Started34 Questions
Exam 3: Defining Measuring and Manipulating Variables62 Questions
Exam 4: Descriptive Methods55 Questions
Exam 5: Data Organization and Descriptive Statistics45 Questions
Exam 6: Correlational Methods and Statistics38 Questions
Exam 7: Probability and Hypothesis Testing60 Questions
Exam 8: Introduction to Inferential Statistics58 Questions
Exam 9: Experimental Design and Analysis I48 Questions
Exam 10: Experimental Design and Analysis II28 Questions
Exam 11: Experimental Design and Analysis III35 Questions
Exam 12: Experimental Design and Analysis Iv48 Questions
Exam 13: Quasi Experimental and Single Case Designs43 Questions
Exam 14: Nonparametric Inferential Statistics23 Questions
Exam 15: APA Communication Guidelines14 Questions
Select questions type
The _____ is a measure of the proportion of variance in one of the variables that is accounted for by the other variable.
(Multiple Choice)
4.8/5  (25)
(25)
If the points on a scatterplot are spread all over the graph, this would suggest that the two variables depicted are
(Multiple Choice)
4.7/5 (36)
A correlation coefficient of 0.00 is to _____ as a correlation coefficient of -1.00 is to _____.
(Multiple Choice)
4.8/5 (37)
Explain when each of the correlation coefficients listed below should be used.
(Essay)
4.7/5 (46)
A variable that is truncated and has limited variability is said to have _____.
(Multiple Choice)
4.9/5 (38)
A correlation coefficient of +1.00 is to _____ as a correlation coefficient of -1.00 is to _____.
(Multiple Choice)
4.7/5 (28)
Assume that the regression equation for the relationship between SAT scores and IQ scores is y=9 + 0.105x. What would you expect the IQ score to be for the following individuals given their SAT scores?
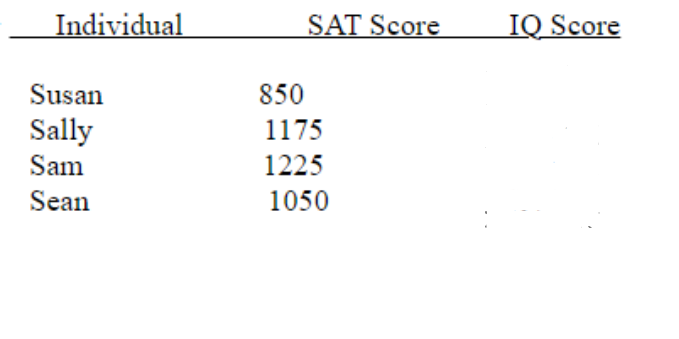
(Essay)
4.9/5 (40)
Two interval/ratio variables are to _____ coefficient as one interval/ratio variable and one nominal variable are to _____ coefficient.
(Multiple Choice)
4.9/5 (42)
If the points on a scatterplot are clustered in a pattern that extends from the lower left to the upper right, this would suggest that the two variables depicted are
(Multiple Choice)
4.8/5 (36)
_____ is a procedure which allows us to predict an individual's score on one variable based on knowing one or more other variables.
(Multiple Choice)
4.8/5 (41)
A correlation coefficient of _____ indicates that the variables form a perfect linear relationship.
(Multiple Choice)
5.0/5 (32)
In a recent study it was found that the correlation between self-esteem and depression was ‑0.64. Tom interprets this to mean that low levels of self-esteem lead to high levels of depression and vice versa. How is Tom misinterpreting these data?
(Essay)
4.9/5 (33)
When there is a _____ relationship, as scores on X increase, scores on Y also increase.
(Multiple Choice)
4.8/5 (30)
General State University recently decided to discontinue its use of the GRE as an admissions tool for its graduate programs because they observed no correlation between GRE scores and subsequent GPAs. Ninety percent of the grades awarded in the graduate programs at General State University are A's. What General State has failed to consider in this situation is the issue of
(Multiple Choice)
4.8/5 (33)
Which of the following correlation coefficients represents the variables with the strongest degree of relationship?
(Multiple Choice)
4.9/5 (41)
Suppose that the correlation between height and weight for adults is +0.75. What proportion (or percent) of the variability in weight is accounted for by the relationship with height?
(Multiple Choice)
4.8/5 (35)
Jim thought that the strong negative correlation that he observed between depression and self-esteem meant that having a low self-esteem led to high levels of depression. Jim is misinterpreting the correlation by assuming
(Multiple Choice)
4.8/5 (40)
Filters
- Essay(0)
- Multiple Choice(0)
- Short Answer(0)
- True False(0)
- Matching(0)