Exam 15: Data Processing and Elementary Data Analysis
Exam 1: Introduction23 Questions
Exam 2: The Nature of Science73 Questions
Exam 3: Research Ethics70 Questions
Exam 4: Elements of Research Design74 Questions
Exam 5: Measurement82 Questions
Exam 6: Sampling89 Questions
Exam 7: Experimentation75 Questions
Exam 8: Experimental Designs71 Questions
Exam 9: Survey Research76 Questions
Exam 10: Survey Instrumentation67 Questions
Exam 11: Field Research70 Questions
Exam 12: Research Using Available Data58 Questions
Exam 13: Multiple Methods65 Questions
Exam 15: Data Processing and Elementary Data Analysis72 Questions
Exam 16: Multivariate Analysis52 Questions
Exam 17: Writing Research Reports49 Questions
Select questions type
Consider the following survey question: "How satisfied are you with the direction that the country is going at this time? Would you say you are very satisfied, somewhat satisfied, not very satisfied, or not at all satisfied?" To collapse the responses into two categories, you would be best advised to
(Multiple Choice)
4.8/5  (31)
(31)
Bivariate distributions may be constructed for variables with nominal and ordinal as well as interval and ratio measurement.
(True/False)
4.9/5 (39)
Wild-code checking and consistency checking are techniques for
(Multiple Choice)
4.9/5 (25)
In the absence of theoretical criteria, the best strategy for collapsing categories is to try to obtain an approximately equal proportion of cases in each category.
(True/False)
4.9/5 (33)
The chi-square test for independence in a contingency table addresses which of the following questions?
(Multiple Choice)
4.7/5 (31)
To interpret the relationship between variables in a contingency table, the rule is "percentage across, read across; percentage down, read down."
(True/False)
4.8/5 (36)
Suppose a small campus survey found that the correlation between alcohol consumption and GPA was −.20 with p < .18. This means that
(Multiple Choice)
4.7/5 (31)
Linear regression analysis should be used only if a straight line provides a reasonable fit to the data.
(True/False)
4.9/5 (33)
The 1994 GSS asked the following question: Do you sometimes drink more than you think you should? The table below breaks down responses to this question by sex.
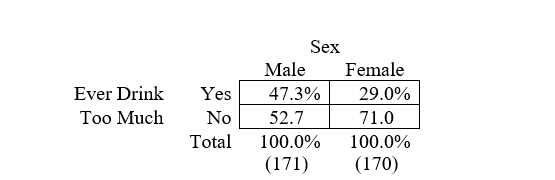 a. What is the percentage difference for determining the association between these variables?
b. Who is more likely to say that they sometimes drink more than they think they should?
c. Chi-square for this table is 12.50, which is significant at p < .001. What does this indicate about the relationship between the variables?
d. The value of phi for this table is .19. What does this statistic tell us about the relationship?
a. What is the percentage difference for determining the association between these variables?
b. Who is more likely to say that they sometimes drink more than they think they should?
c. Chi-square for this table is 12.50, which is significant at p < .001. What does this indicate about the relationship between the variables?
d. The value of phi for this table is .19. What does this statistic tell us about the relationship?
(Not Answered)
This question doesn't have any answer yet
Listwise deletion is the best method of handling missing values, regardless of the number of missing cases.
(True/False)
4.8/5 (34)
Describe the differences in the bivariate analysis of nominal/ordinal variables and interval/ratio variables. What descriptive and inferential statistics are used to describe each type of variable?
(Essay)
4.9/5 (43)
Using computer-assisted interviewing eliminates the need for coding and data cleaning.
(True/False)
4.8/5 (31)
Univariate distributions of interval-/ratio-scale variables include all but which one of the following properties?
(Multiple Choice)
4.9/5 (25)
What is the usual order of steps in processing completed survey interviews or questionnaires?
(Multiple Choice)
4.9/5 (39)
Consider the following table from the 2016 GSS, which shows the relationship between race and whether someone favors or opposes "the death penalty for persons convicted of murder."
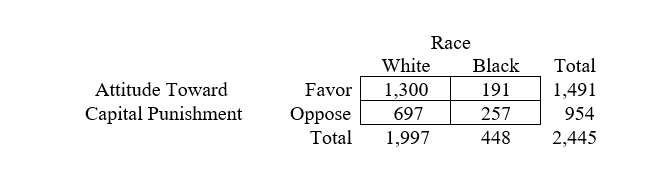 The data in this table suggest that (the answer may require some calculation)
(Multiple Choice)
4.8/5 (31)
For the 2016 GSS, you regress respondent's years of education completed (Y) on father's years of education completed (X) and obtain the following result: Y = 10.24 + .32X. What would be the predicted years of a respondent's education if his or her father had completed 12 years of schooling?
(Multiple Choice)
4.9/5 (29)
A correlation of −.85 indicates a __________ relationship, and a correlation of +.10 indicates a __________ relationship.
(Multiple Choice)
4.7/5 (39)
Descriptive and inferential statistics correspond to the scientific goals of description and explanation.
(True/False)
4.9/5 (36)
For the 2016 GSS, you regress number of hours of television watched on the average day (Y) on number of years of education completed (X) and obtain the following result:
Y = 5.37 - .18X. What would be the predicted number of hours of television watched per day if the respondent has completed 12 years of schooling?
(Multiple Choice)
5.0/5 (35)
Filters
- Essay(0)
- Multiple Choice(0)
- Short Answer(0)
- True False(0)
- Matching(0)