Exam 10: Quasi-Experiments and Evaluation Research
Exam 1: Basic Concepts37 Questions
Exam 2: Internal and External Validity30 Questions
Exam 3: Measurement Reliability28 Questions
Exam 4: Measurement Validity29 Questions
Exam 5: Designing Experiments20 Questions
Exam 6: Constructing Laboratory Experiments31 Questions
Exam 7: External Validity of Laboratory Experiments33 Questions
Exam 8: Conducting Experiments Outside the Laboratory23 Questions
Exam 9: Nonexperimental Research36 Questions
Exam 10: Quasi-Experiments and Evaluation Research31 Questions
Exam 11: Survey Studies32 Questions
Exam 12: Systematic Observational Methods21 Questions
Exam 13: Interviewing27 Questions
Exam 14: Content Analysis17 Questions
Exam 15: Questionnaire Design and Scale Construction22 Questions
Exam 16: Indirect and Implicit Measures of Cognition and Affect24 Questions
Exam 17: Scaling Stimuli23 Questions
Exam 18: Methods for Assessing Dyads and Groups19 Questions
Exam 19: Synthesizing Research Results33 Questions
Exam 20: Social Responsibility and Ethics in Social Research21 Questions
Select questions type
What conditions must be met to be able to appropriately conduct an impact (or outcome) evaluation? (circle all that apply)
(Multiple Choice)
5.0/5  (38)
(38)
Describe the basic and defining features of a quasi-experiment, and provide one specific example situation where using a quasi-experimental design would be preferred.
(Essay)
4.9/5 (45)
Which of the following graphs reflect possible outcomes of a growth curve modeling design? (circle all that apply)
(Multiple Choice)
4.8/5 (29)
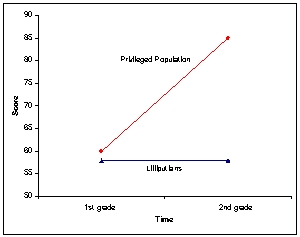
Evaluators were interested in the long-term efficacy of a new early intervention education programs for Lilliputians, by far the most underprivileged population in the world. There had been considerable past research that showed without intervention, academic achievement in Lilliputians actually gets worse over time, whereas achievement in privileged populations tends to increase. For example, in a previous cross-sectional assessment of achievement, the average academic achievement for these populations is provided in the table below. To investigate the effect of this program on Lilliputians' subsequent academic achievement, the researchers decided to give themselves the best possible chance of detecting a treatment effect and compare the achievement of the highest performing Lilliputians to students from the privileged population with similar scores on the pretest (i.e., the lowest performers from the privileged population). Their results can be seen in the figure below. They conclude that the educational program was a bust, as it appears that even the best Lilliputians showed no change in their academic aptitude, while those in the privileged population, who were not exposed to any treatment, improved considerably. Was their conclusion warranted? In your response, (a) explain whether their conclusion was warranted or not; (b) explain how regression toward the mean might be affecting the results for both populations; (c) explain whether you think the education program was successful - in other words, based on what you know about regression toward the mean, discuss the likely outcomes for both populations in the absence of any treatment, and then compare that to the observed results when a treatment was present for the Lilliputians. (d) Finally, if you had all of the resources available in the world, provide an example for how you could use a regression discontinuity design to test for the causal effects of an educational intervention on the worst-performing Lilliputians. Be sure to describe the time frame of the study and how often data points would be collected, how participants would be assigned to groups, and after the intervention is applied, how you would determine whether it had an effect.
Lilliputians Privileged Population Grade 1 st 2nd 1 st Mean test score (out of 100) 50 40 80 95 Sample scores 58 58 60 85
(Not Answered)
This question doesn't have any answer yet
With propensity scores analyses, the difference between observed and counterfactual scores reflects changes attributable to:
(Multiple Choice)
4.8/5 (37)
In terms of internal validity (i.e., least vulnerable to internal validity threats is first, most vulnerable is last), experimental methods, correlational methods, and quasi-experimental methods would be organized as:
(Multiple Choice)
4.8/5 (43)
This type of evaluation is used to determine whether a planned program can be implemented and delivered as expected, given existing restraints.
(Multiple Choice)
4.9/5 (41)
Which of the following techniques is an accepted method of controlling for regression artifacts?
(Multiple Choice)
4.8/5 (31)
You are interested in how teenagers think about decision making, and want to use naturalistic observation to assess the frequency of different thoughts, and valence of those thoughts, that a person experiences when asked to respond to a given stimuli (e.g., when asked whether he or she would try a new type of illicit drug). How could you do it? Could you use facial expressions in some way? What about eye movement or other unobtrusive physiological movements or responses? How else could you observe cognition (albeit indirectly) as unobtrusively and as "naturally" as possible? What might your coding scheme look like for these behavioral observations?
(Essay)
4.8/5 (40)
What kinds of research questions or contexts might lend themselves to the use of growth curve modeling; of the regression-discontinuity design?
(Essay)
4.8/5 (42)
Filters
- Essay(0)
- Multiple Choice(0)
- Short Answer(0)
- True False(0)
- Matching(0)