Exam 27: Simple Analytics of Supply and Demand
Exam 1: Prehistoric Communal Institutions in the Middle East46 Questions
Exam 2: Communal Equality to Slavery in the Middle East44 Questions
Exam 3: Slavery to Feudalism in Western Europe23 Questions
Exam 4: Feudalism and Paternalism in England30 Questions
Exam 5: Feudalism to Capitalism in England43 Questions
Exam 6: Mercantilism in England37 Questions
Exam 7: Pre-Capitalism to Industrial Capitalism in the United States 1776-186542 Questions
Exam 8: Classical Liberalism Defense of Industrial Capitalism27 Questions
Exam 9: Socialist Protest Against Industrial Capitalism27 Questions
Exam 10: Marx Critique and Alternative to Capitalism51 Questions
Exam 11: Rise of Corporate Capitalism in the United States, 1865-190035 Questions
Exam 12: Neoclassical Economics Defense of Corporate Capitalism23 Questions
Exam 13: Veblen Critique of Corporate Capitalism39 Questions
Exam 14: Growth and Depression in the United States, 1900-194038 Questions
Exam 15: Keynesian Economics and the Great Depression21 Questions
Exam 16: The United States and Global Capitalism, 1940-200659 Questions
Exam 17: Robinson Crusoe Two Perspectives on Microeconomics24 Questions
Exam 18: The Two Americas Inequality, Class, and Conflict26 Questions
Exam 19: Inequality, Exploitation, and Economic Institutions38 Questions
Exam 20: Prices, Profits, and Exploitation36 Questions
Exam 21: Market Power and Global Corporations33 Questions
Exam 22: Economics of Racial and Gender Discrimination28 Questions
Exam 23: Environmental Devastation31 Questions
Exam 24: Government and Inequality40 Questions
Exam 25: Economic Democracy33 Questions
Exam 26: Scarcity and Choice Neoclassical View59 Questions
Exam 27: Simple Analytics of Supply and Demand100 Questions
Exam 28: Consumption Theory: Demand39 Questions
Exam 29: Production Theory Supply50 Questions
Exam 30: Costs of Production46 Questions
Exam 31: Work and Wages Neoclassical View of Income Distribution53 Questions
Exam 32: Prices and Profits in Perfect Competition30 Questions
Exam 33: Monopoly, Power, Prices, and Profits27 Questions
Exam 34: Monopolistic Competition and Oligopoly21 Questions
Exam 35: Market Failures Public Goods, Market Power, and Externalities46 Questions
Exam 36: History of Business Cycles and Human Misery25 Questions
Exam 37: National Income Accounting How to Map the Circulation of Money and Goods42 Questions
Exam 38: Money and Profit Says Law and Institutionalist Criticism23 Questions
Exam 39: Neoclassical View of Aggregate Supply and Demand21 Questions
Exam 40: Keynesian View of Aggregate Supply and Demand28 Questions
Exam 41: How to Measure Instability26 Questions
Exam 42: Consumer Spending and Labor Income31 Questions
Exam 43: Investment Spending and Profit22 Questions
Exam 44: The Multiplier27 Questions
Exam 45: Business Cycles and Unemployment33 Questions
Exam 46: Growth and Waste32 Questions
Exam 47: Fiscal Policy45 Questions
Exam 48: Government Spending and Taxes18 Questions
Exam 49: Money, Banking, and Credit42 Questions
Exam 50: Inflation36 Questions
Exam 51: Monetary Policy39 Questions
Exam 52: Exports and Imports19 Questions
Exam 53: International Trade, Investment, and Finance How Instability Spreads Around the World19 Questions
Exam 54: Debate on Globalization24 Questions
Exam 55: Debate on Free Trade51 Questions
Exam 56: Development32 Questions
Select questions type
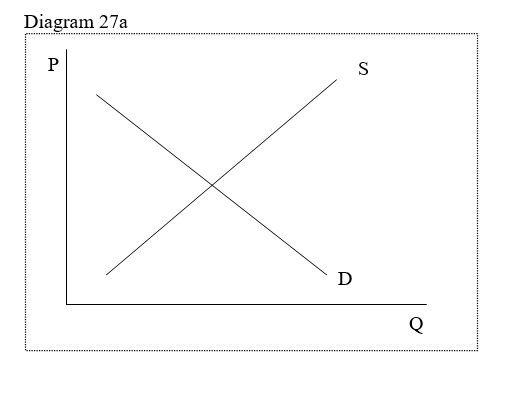 -In Diagram 27a, the demand curve represented by line D shows
Free
(Multiple Choice)
4.9/5  (41)
(41)
Correct Answer: Verified
B
Understand and describe what happens when a market is not in equilibrium.
-Draw a simple supply and demand curve diagram for coffee. Assume that incomes of consumer are rising. What happens to demand and supply? What happens to equilibrium price and quantity?
Free
(Essay)
4.8/5 (39)
Correct Answer:Verified
Higher consumer income causes an increase in demand Equilibrium price and quantity increase
Explain the limitations of elasticity (demand, supply, income, and cross-price).
-What are some problems with measuring the various types of elasticities?
Free
(Essay)
4.7/5 (33)
Correct Answer:Verified
Researchers collect price and quantity data, but may not be able to derive the correct demand curve
Understand and describe what happens when a market is not in equilibrium.
-What factors can cause a change in supply? What causes a change in the quantity ?supplied?
(Essay)
4.9/5 (38)
Understand and describe what happens when a market is not in equilibrium.
-Use supply and demand to explain excess demand. What might cause excess demand? Describe the process that eliminates excess demand.
(Essay)
5.0/5 (24)
Price Quantity Demanded Quantity Demanded in January in February \ 35,000 35,000 40,000 \ 30,000 40,000 45,000 \ 25,000 45,000 50,000 \ 20,000 50,000 55,000 \ 15,000 55,000 60,000
-Assume Table 27a represents demand schedules for Ford Explorers. In January consumers would have been willing to purchase 45,000 cars at a price of $25,000. In February, they would have been willing to purchase 50,000 cars at a price of $25,000. This change represents
(Multiple Choice)
4.8/5 (34)
If the quantity demanded of good A falls when the price of good B rises, then good A and good B are
(Multiple Choice)
4.9/5 (40)
Understand and describe what happens when a market is not in equilibrium.
-Would a firm planning a price increase be better off if the demand for its product was elastic or inelastic? Explain.
(Essay)
4.7/5 (41)
Understand and describe what happens when a market is not in equilibrium.
-What three factors can cause a change in demand? What factor can cause a change in the quantity demanded?
(Essay)
4.9/5 (43)
Price Quantity Demanded Quantity Supplied per per month month 35,000 35,000 55,000 \ 30,000 40,000 50,000 \ 25,000 45,000 45,000 \ 20,000 50,000 40,000 15,000 55,000 35,000
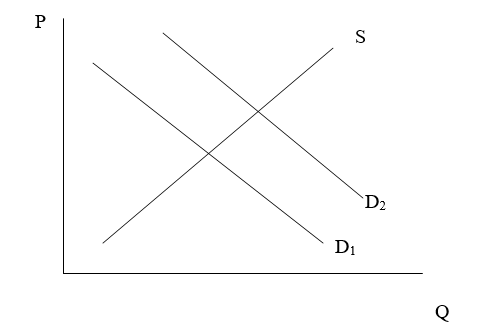
-Assume Diagram 27.1a represents the market for wheat bread. What is a possible cause of the shift in demand from D1 to D2?
(Multiple Choice)
4.8/5 (40)
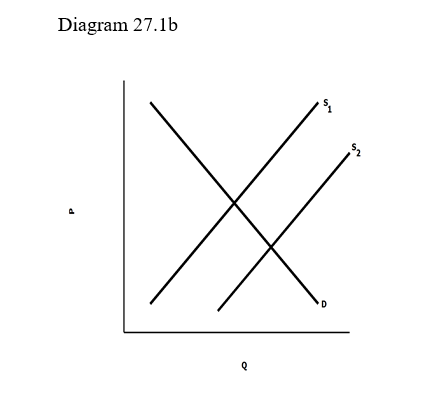 -Assume Diagram 27.1b represents the market for wheat bread. What is a possible cause of the shift in demand from S1 to S2?
(Multiple Choice)
5.0/5 (44)
Price Quantity Demanded Quantity Supplied per per month month 35,000 35,000 55,000 \ 30,000 40,000 50,000 \ 25,000 45,000 45,000 \ 20,000 50,000 40,000 15,000 55,000 35,000
-Assume Diagram 27.1a represents the market for wheat bread. The shift in demand from D1 to D2 will
(Multiple Choice)
4.7/5 (43)
Filters
- Essay(0)
- Multiple Choice(0)
- Short Answer(0)
- True False(0)
- Matching(0)